Cross-Filtering and Cross-Highlighting of Visuals in a Report
All visuals on a report page are connected. When you select a data point in one visual, other visuals on the same page that contain related data update automatically.
By default, selecting a data point triggers cross-filtering or cross-highlighting across all visuals on the page.
These interactions help you understand how one data value relates to others. The terms cross-filter and cross-highlight describe this visual interaction behavior and are distinct from filtering applied through the Filters pane.
For example, consider the Entitlements report with the Quantity Ordered Trend bar chart showing multiple products.
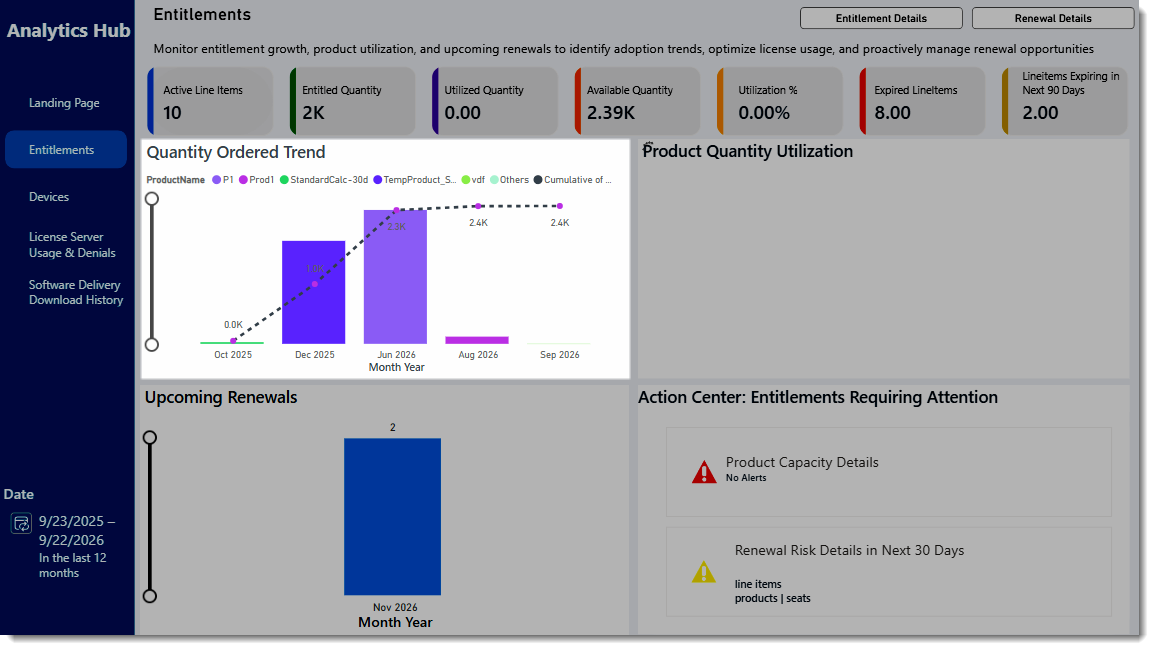
The following screenshot shows how the view changes when product P1 is selected:
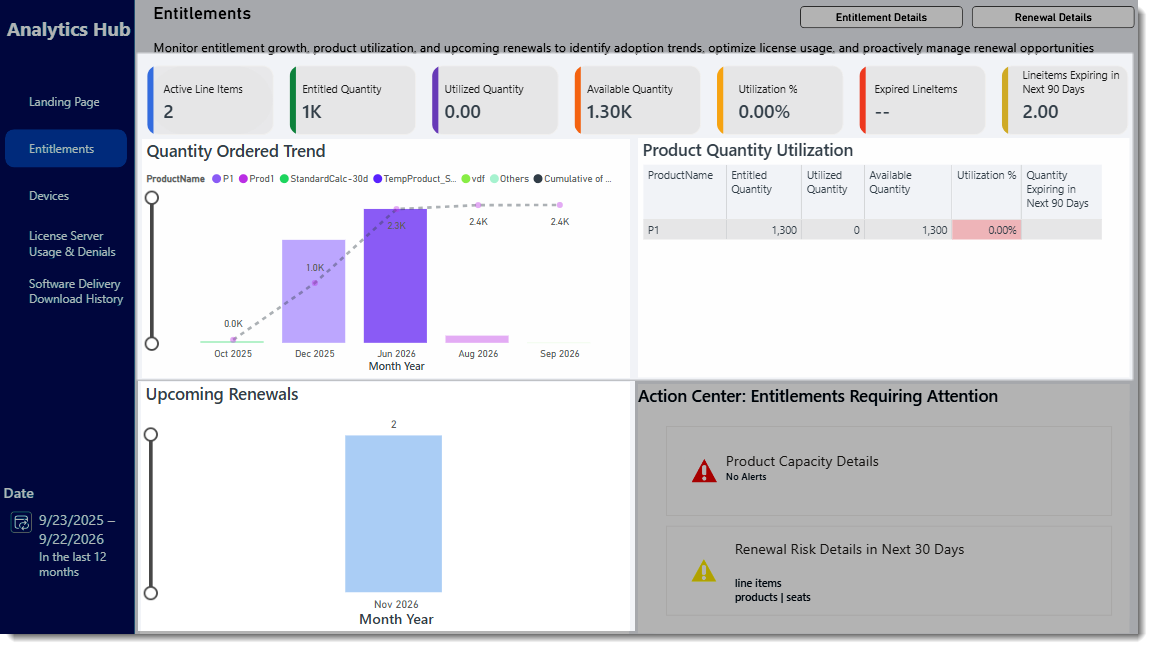
Selecting P1 in the bar chart has the following effect:
| • | Cross-filtering removes unrelated data. Selecting P1 in the Quality Ordered Trend bar chart cross-filters all other visuals on the page, which now only display data points associated with product P1. |
| • | Cross-highlighting retains all the original data points but dims the portion that doesn't apply to your selection. Selecting P1 in the bar chart cross-highlights the portion in all visuals that apply to product P1. In Quantity Ordered Trend, the bars for other (unselected) products appear dimmed. |