Analytics Hub Landing Page
Use the Analytics Hub landing page to review key metrics at a glance and navigate to detailed analytics dashboards for specific reporting areas.
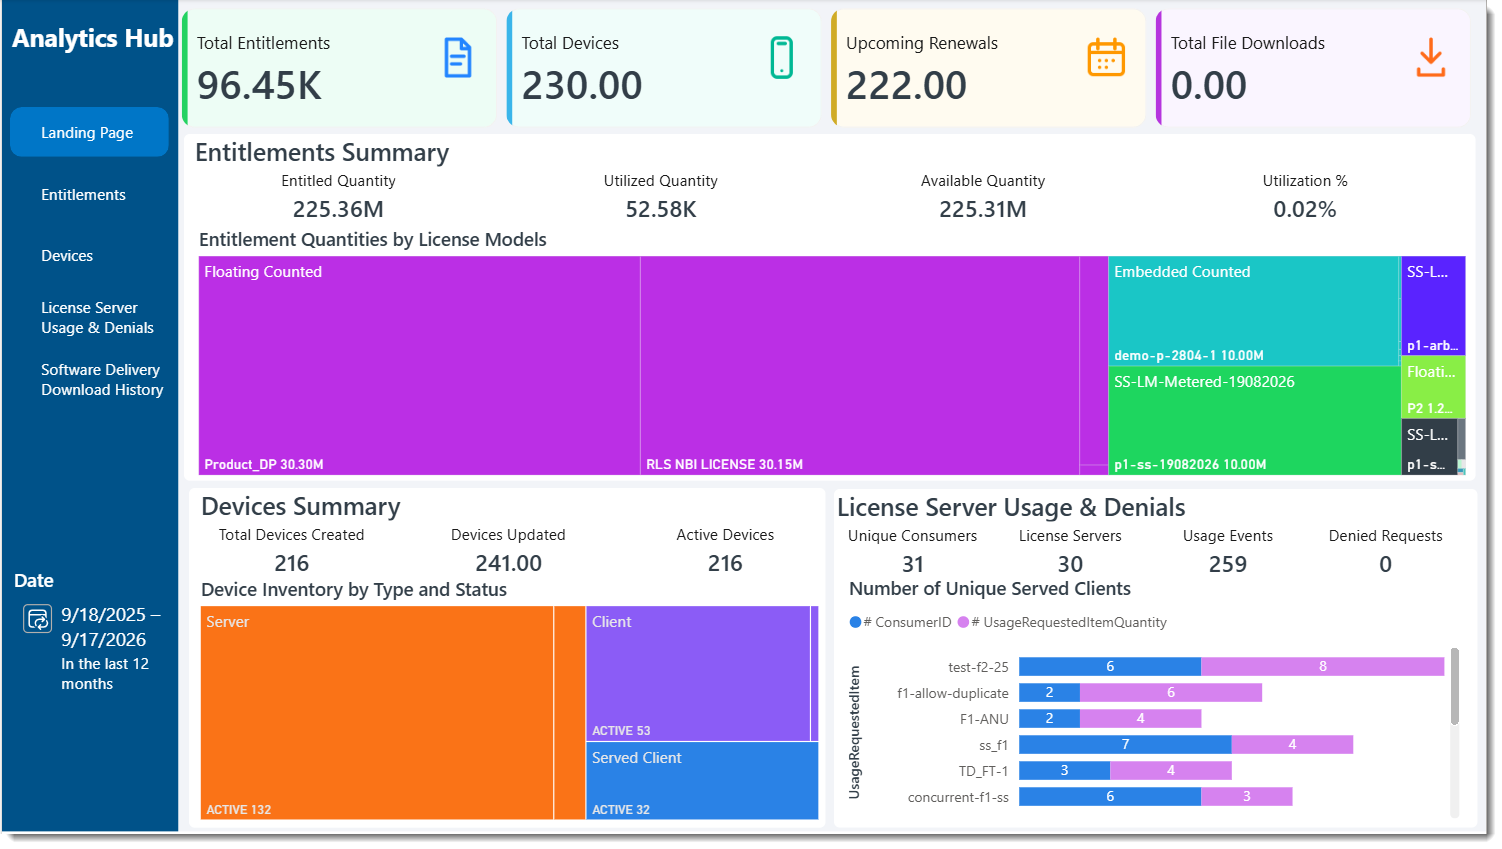
Analytics Hub Landing Page
Key Data on the Landing Page: Tiles and Dashboards
Tiles on the Landing Page
The tiles at the top of the page provide key metrics for your organization.
|
Tile |
Description |
|
Total Entitlements |
Displays the total number of entitlements available to your organization. Use this metric to understand the overall volume of entitled software, licenses, or services. |
|
Total Devices |
Displays the total number of devices associated with your organization. This metric provides a quick indication of software deployment and device activity. |
|
Upcoming Renewals |
Displays the number of entitlements or licenses approaching their renewal date. This metric helps identify upcoming renewal requirements and potential renewal risks. |
|
Total File Downloads |
Displays the volume of software download activity for your organization, helping you track software delivery and deployment activity. |
Entitlements Summary Dashboard
The Entitlements Summary dashboard provides an overview of entitlement allocation and utilization within your organization. It includes information such as:
| • | Total entitled quantity |
| • | Quantity currently in use |
| • | Available quantity remaining |
| • | Overall utilization percentage |
| • | Entitlement distribution by license model |
Use this dashboard to understand license consumption patterns, identify underutilized entitlements, and evaluate whether additional licenses are required.
Devices Summary Dashboard
The Devices Summary dashboard provides visibility into device activity across your organization, including:
| • | Total devices created |
| • | Devices updated |
| • | Active devices |
Use this dashboard to monitor software adoption and deployment activity and to identify inactive or dormant device installations.
License Server Usage & Denials Dashboard
The License Server Usage & Denials dashboard provides information about license server activity and license consumption, including:
| • | Unique consumers |
| • | License servers |
| • | Usage events |
| • | Denied requests |
Use this dashboard to understand how licenses are being consumed and to identify potential licensing constraints or access issues. License denial insights can help uncover capacity bottlenecks, feature demand trends, access constraints, and opportunities to optimize license allocation and renewal planning.