Data Analytics Enhancements in 2025.02
The following enhancement was made to the Analytics functionality in 2025.02.
New Report to Analyze Denied Access Requests
The License Server Usage report (under Analytics > License Server Usage) has been expanded to include a new chart, called Denials Distribution, covering denials data. To reflect this new capability, the License Server Usage report has been renamed to License Server Usage and Denials.
The License Server Usage and Denials report analyzes the denials made by a Cloud Licensing Service (CLS) instance, Dynamic Monetization instance or a local license server and provides insights into causes and patterns where requests to access licensed software were rejected. The report reveals details about:
| • | Denial reasons—Reasons are grouped by the denial status code, along with the percentage distribution per denial code. Identifying the most common reasons for denials—such as, for example, insufficient feature counts or elastic tokens, expired features, features not available due to rule rejection—allows producers and their customer to take corrective action. |
| • | Denial patterns—Discover which accounts are experiencing the highest number of denials. This information helps producers uncover key accounts that might not be sufficiently provisioned with licenses to meet their day-to-day operational requirements. |
| • | Denial trends—Patterns in denied requests can help producers forecast future demand for certain features, products, or license types. This insight supports better resource allocation, product development, and infrastructure planning to meet anticipated growth. |
Clicking the Denials Distribution chart opens a new page which shows the Denials Distribution pie chart, the Denials by Account bar chart, and the Denials Summary table (described below).
Note:For usage data from a local license server to be available in the Data Warehouse, the following policy settings must be configured:
| • | usageService.sync.enabled—Must be set to true. |
| • | usageService.sync.url—Must point to the usage service URL, which is |
https://<siteId>.compliance.flexnetoperations.com/usage/api/1.0/sync
where <siteId> is replaced with the specific site ID supplied by Revenera, for example:
https://flex1234.compliance.flexnetoperations.com/usage/api/1.0/sync
| • | licensing.trackDeniedRequests—Must be set to true if the usage data should also include denied request information. To disable tracking of denied requests, licensing.trackDeniedRequests set to false. |
For more information, see the topic “Pushing Usage Data to the Data Warehouse” in the FlexNet Embedded License Server Producer Guide (available from the Product and License Center).
Denials Distribution Pie Chart
The Denials Distribution pie chart visualizes the different types of denials along with their percentage distribution, providing insights into denial patterns. Hover over a pie slice to see the following information:
| • | Denial status code and description |
| • | Absolute number of denials |
| • | Percentage of denials |
You can filter the pie chart using the using the widget filter at the top, to focus on specific denial status codes, accounts, or other criteria.
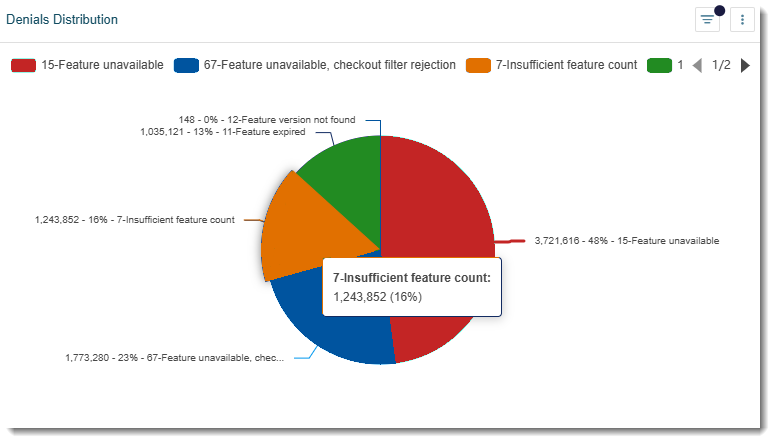
Example of a Denials Distribution pie chart
The Denials by Account bar chart shows the denials segmented by account, offering valuable insights into the key accounts that should be prioritized for revenue generation opportunities.
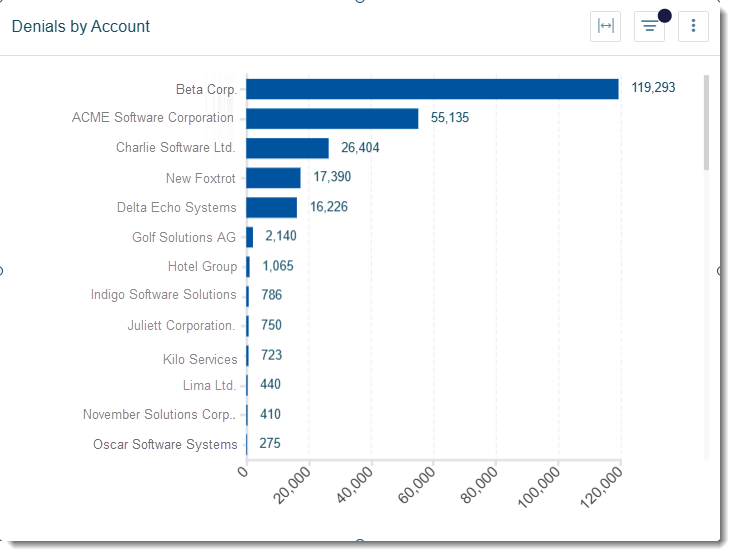
Example of a Denials by Account bar chart
The Denials Summary table offers detailed insights into denials, showing data such as users/clients, features and timestamp, enabling data-driven conversations with customers.
Insights Gained From the Denials Distribution Report
The following example illustrates how producers might benefit from the insights provided by the Denials Distribution report.
Let’s assume that your Software as a Service (SaaS) company offers subscription-based software licenses, but users frequently face license checkout denials when trying to access the software. You generate a Denials Distribution report to analyze the issue. The screenshot below shows the findings of the report:
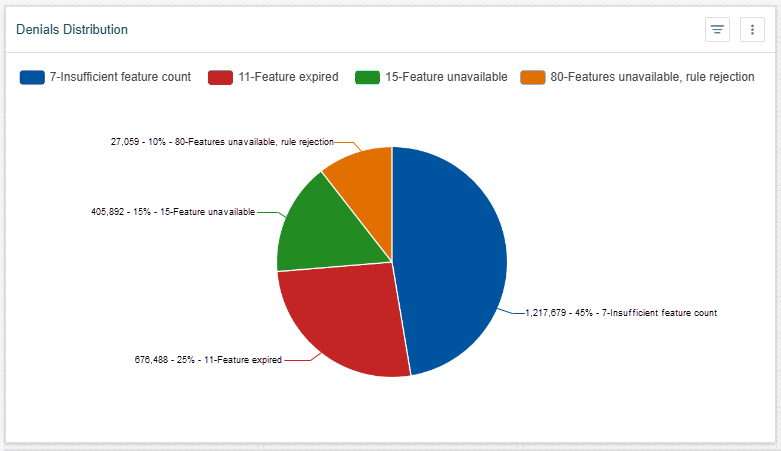
The report lists the most common denial reasons, which enables you to take action and turn the denials into upsell or cross-sell opportunities. This in turn also reduces the impact on your customer support team.
|
Denial Reason |
Denial Rate (%) |
Insights |
Opportunity |
||||||
|
Insufficient feature count available Insuffient elastic tokens available (Dynamic Monetization) |
45% |
The main reason for denials is that demand exceeds the current subscription plan. |
Upselling additional licenses: Sales, the Renewals team or Customer Sucess Managers can leverage the report’s insights to discuss upgrading the subscription plan, introduce dynamic license allocation or on-demand scaling with the customer. |
||||||
|
Feature expired No valid active line items (Dynamic Monetization) |
25% |
Loss of revenue due to missed renewals. |
Increase renewal opportunities: Engage the Renewals team to lead data-driven conversation with the customer. Send proactive renewal reminders, set up automated renewal reminders, or enable auto-renewal. |
||||||
|
Feature unavailable Item not found in any effective rate table (Dynamic Monetization) |
15% |
User attempting to access a premium product not included as part of the current subscription plan. |
The Sales or Renewals team can leverage this opportunity for cross-selling or upselling. |
||||||
|
Feature unavailable, checkout filter rejection Feature unavailable, rule rejection |
10% |
Users unable to activate software due to rules of access or feature selectors. |
Opportunity to upsell additional licenses: The denials might indicate additional demand for a feature. Customer Sucess Managers could share this report with the enterprise license administrator to enable them to:
|