Usage Over Time Page
The Usage Over Time page provides a visual representation of the usage trends for a selected feature associated with a selected vendor daemon. It offers insights into how the usage of the feature has evolved over a specified period. The following displays the graphical representation of a selected feature usage over specific interval on the Usage Over Time page:
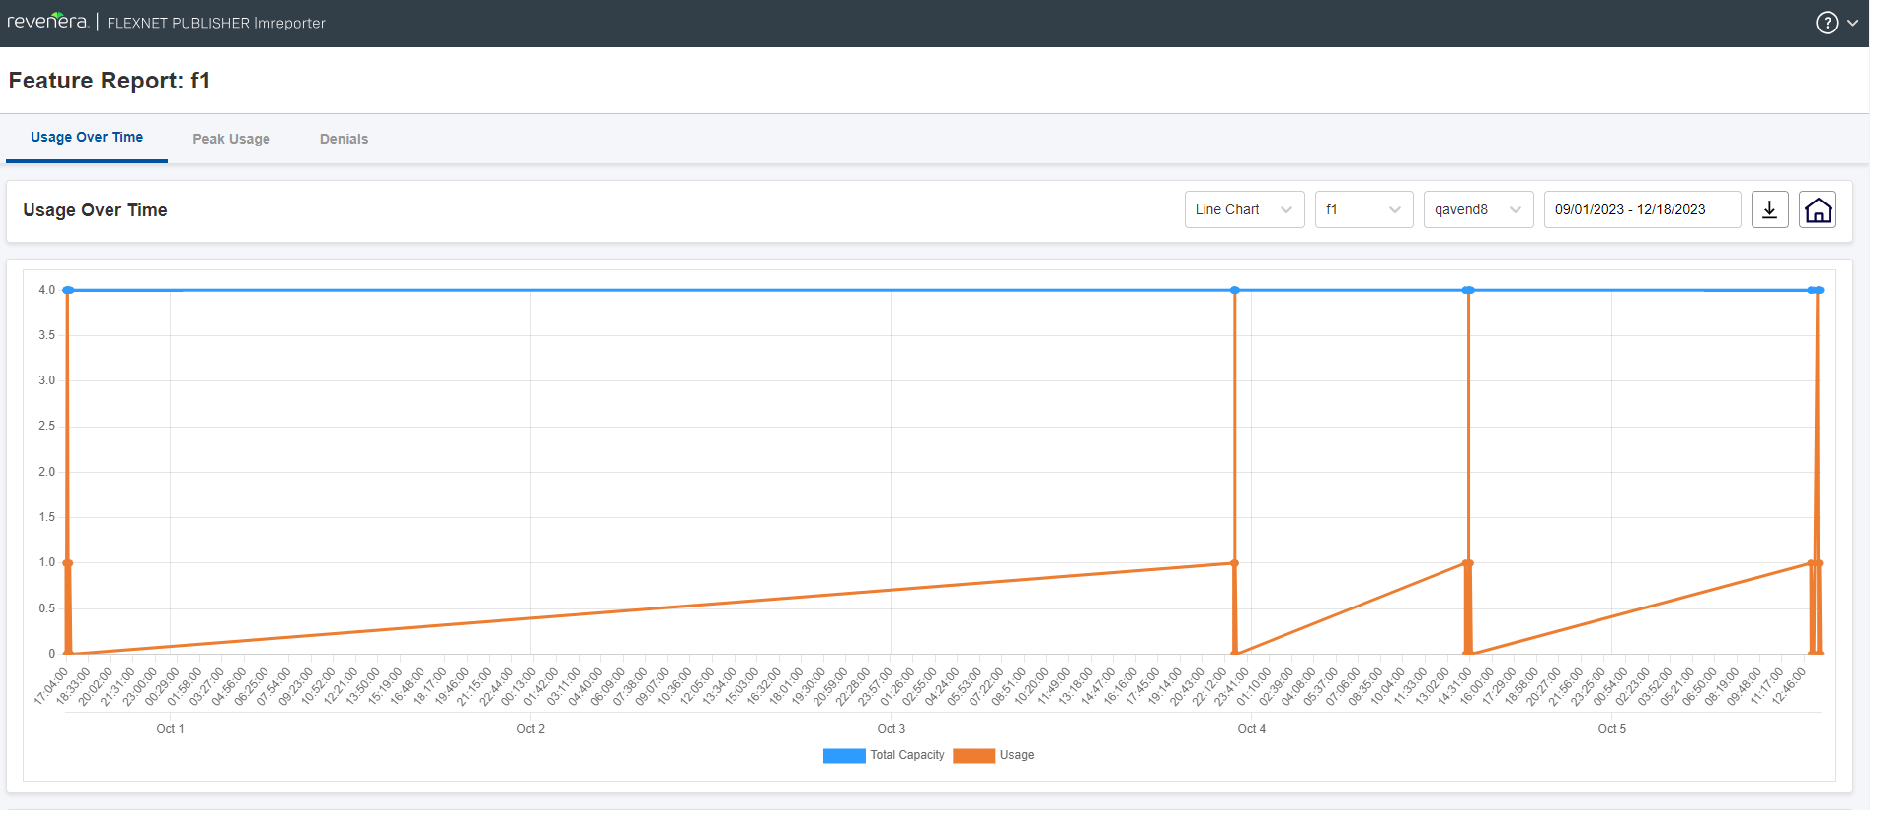
Usage Over Time Page
Key Features
The following are the key features of this page:
| • | Time-based visualization—This page presents a graphical representation of usage trends, allowing users to observe the patterns and fluctuations over the regular interval. |
| • | Feature-centric view—Users can track the usage of a specific feature and gain valuable information about its popularity, growth, or potential decline. |
You can use the drop-down menus above the chart to select a different feature, vendor daemon, or date range:
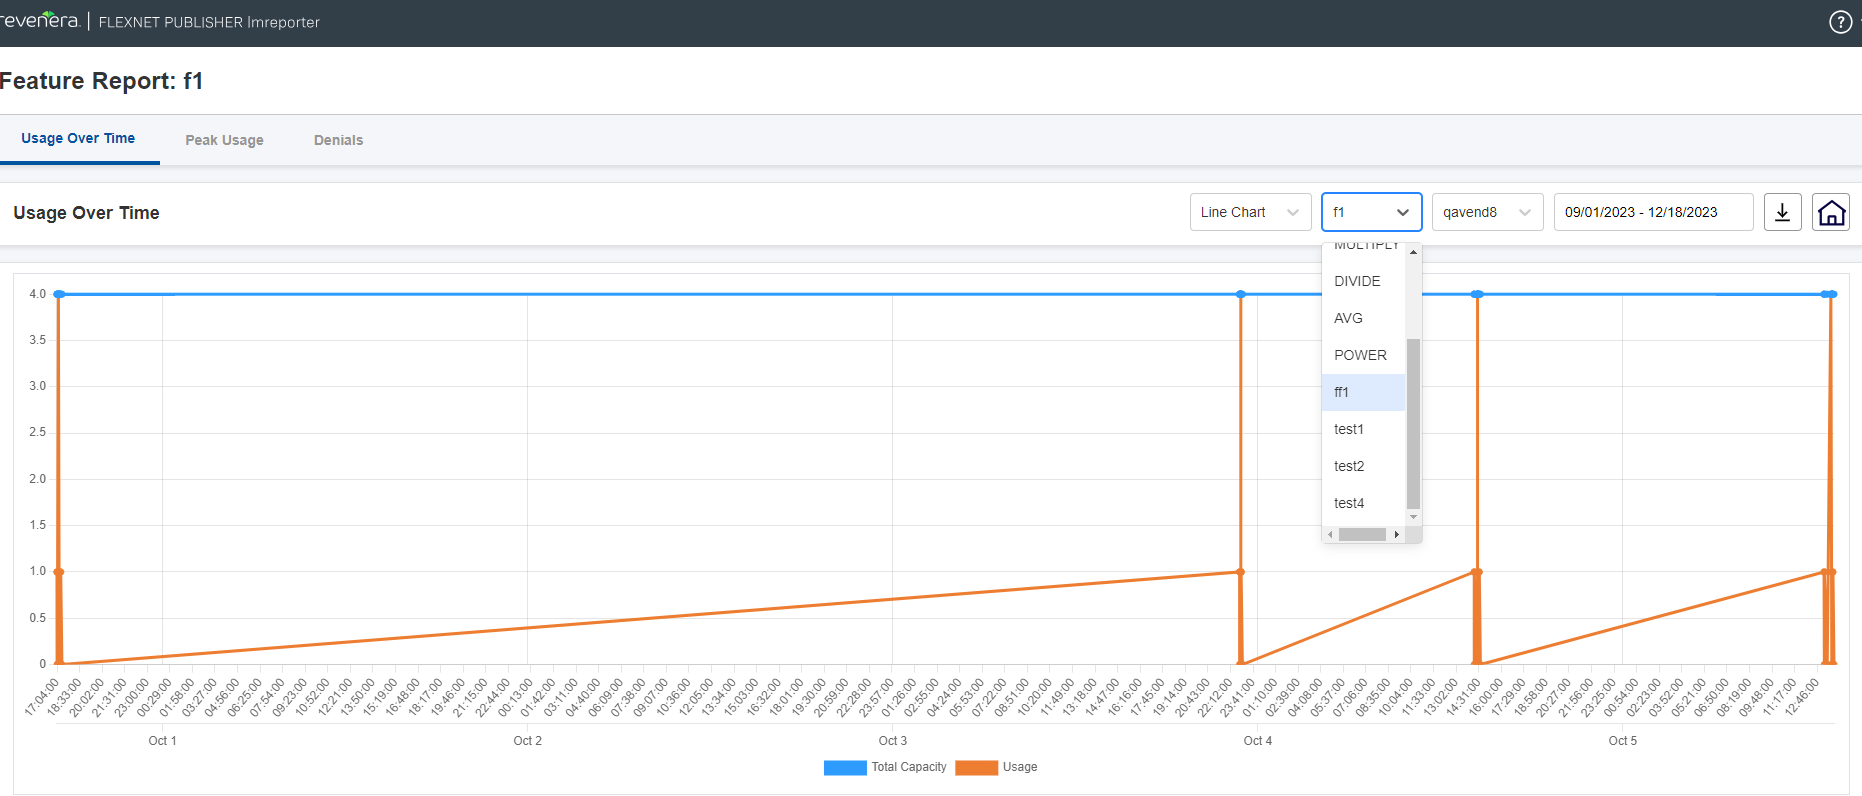
Usage Over Time Page with Feature Drop-Down
The following page shows selecting a specific vendor daemon:
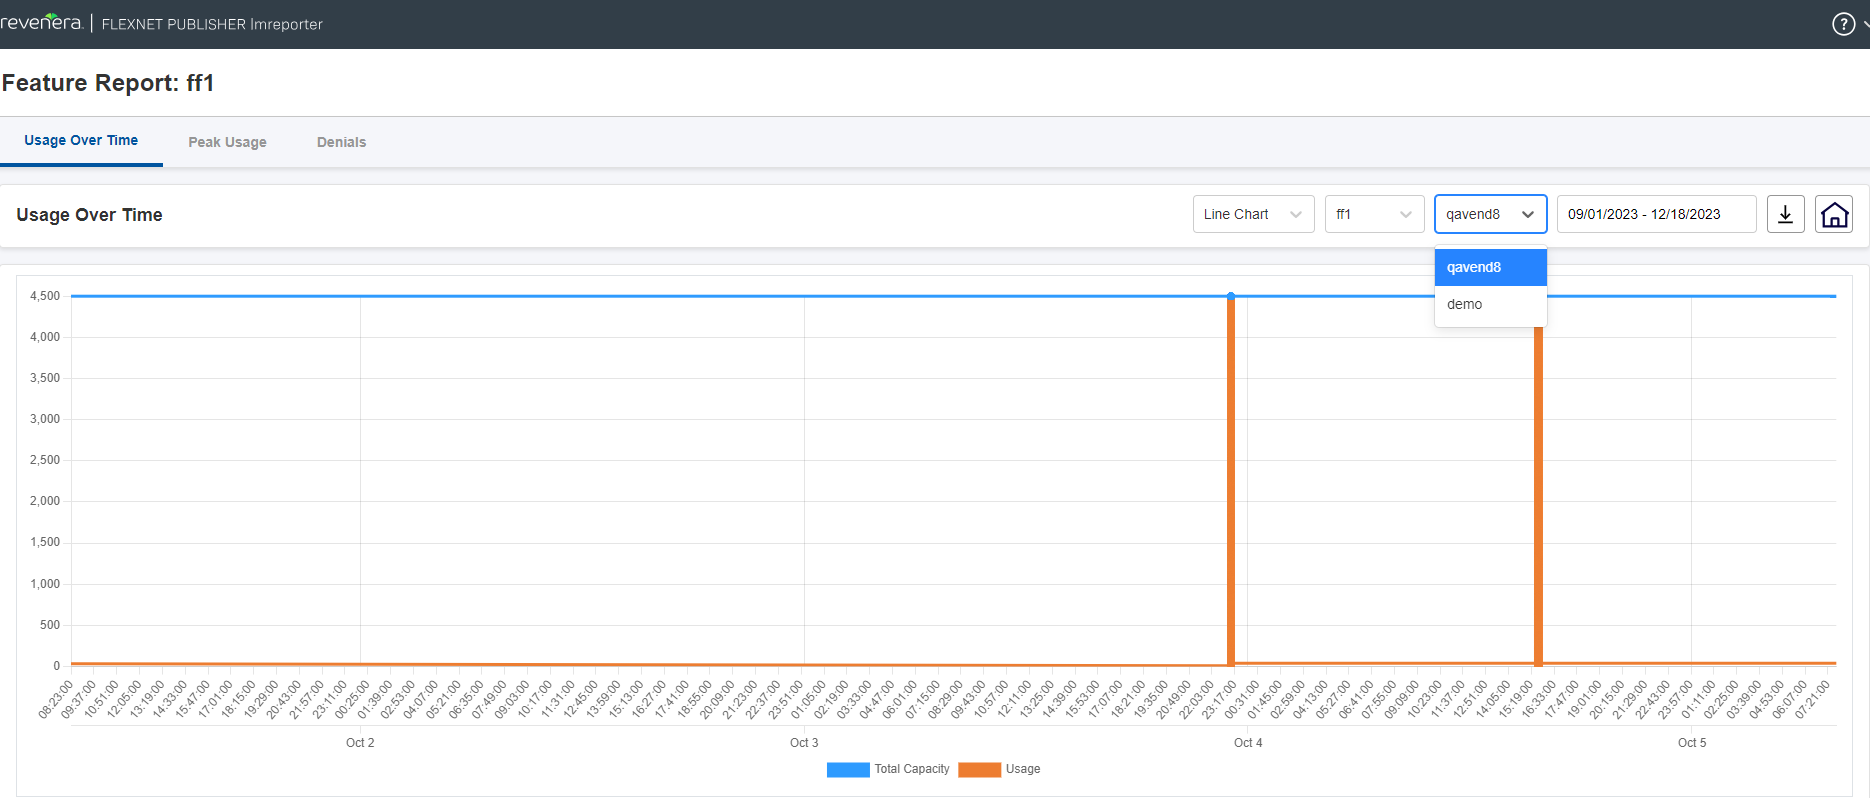
Usage Over Time Page with Vendor Daemon Drop-Down
The end user has the flexibility to choose the desired date range for the report creation.
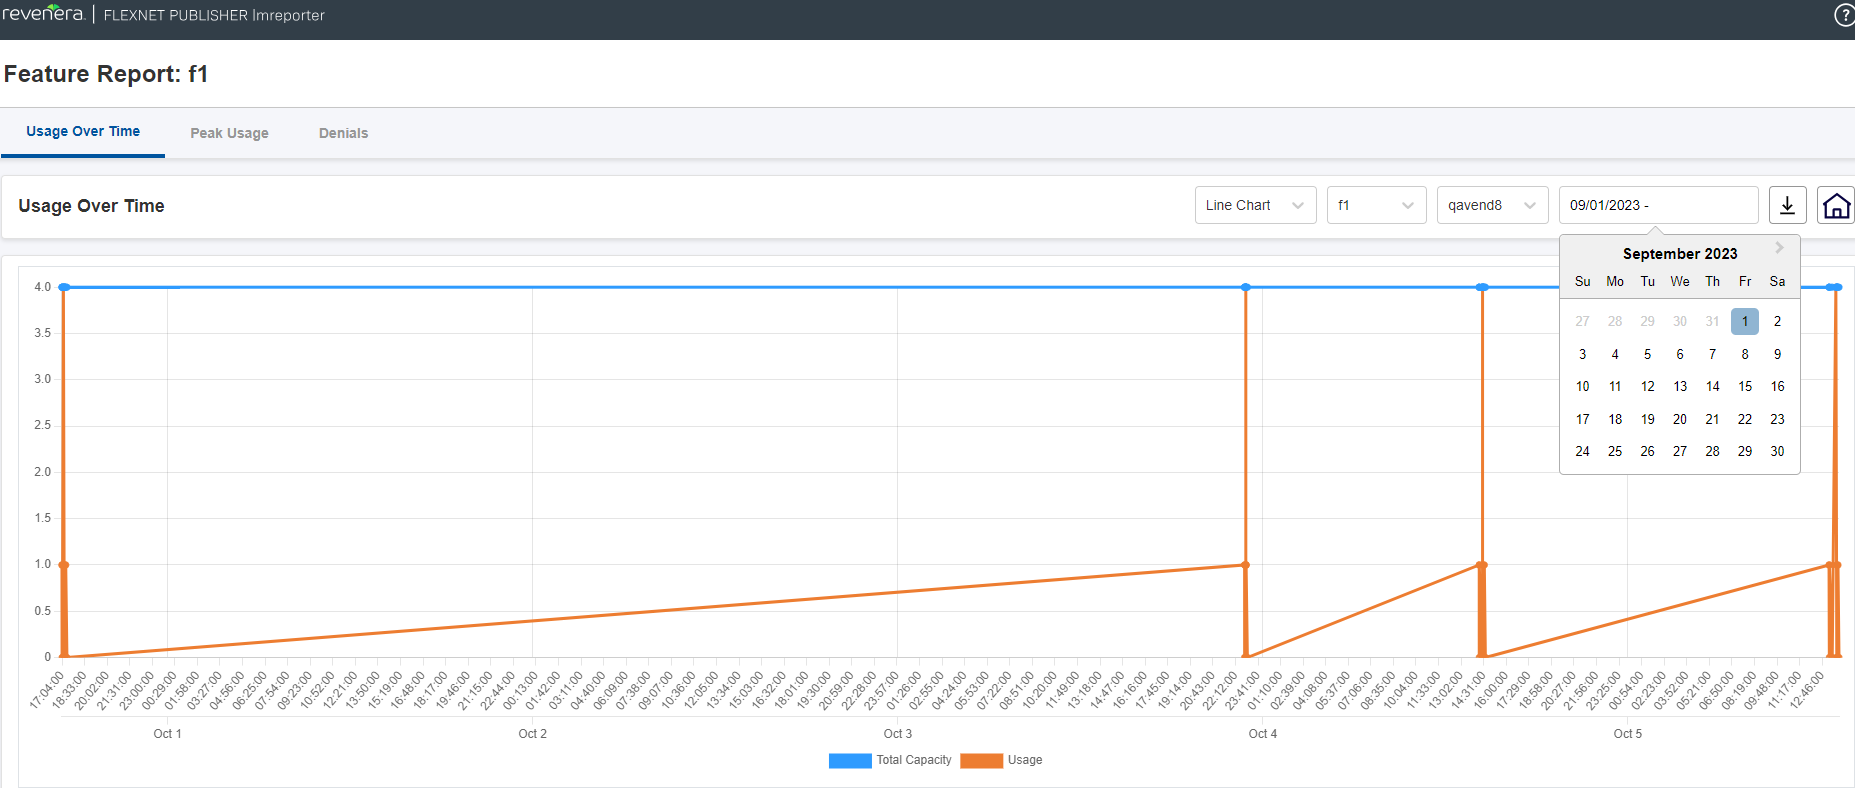
Usage Over Time Page with Date Range Selection
Below all graphs, a table containing comprehensive data related to the presented information is displayed. This table offers a more granular breakdown of the data points shown in graph:
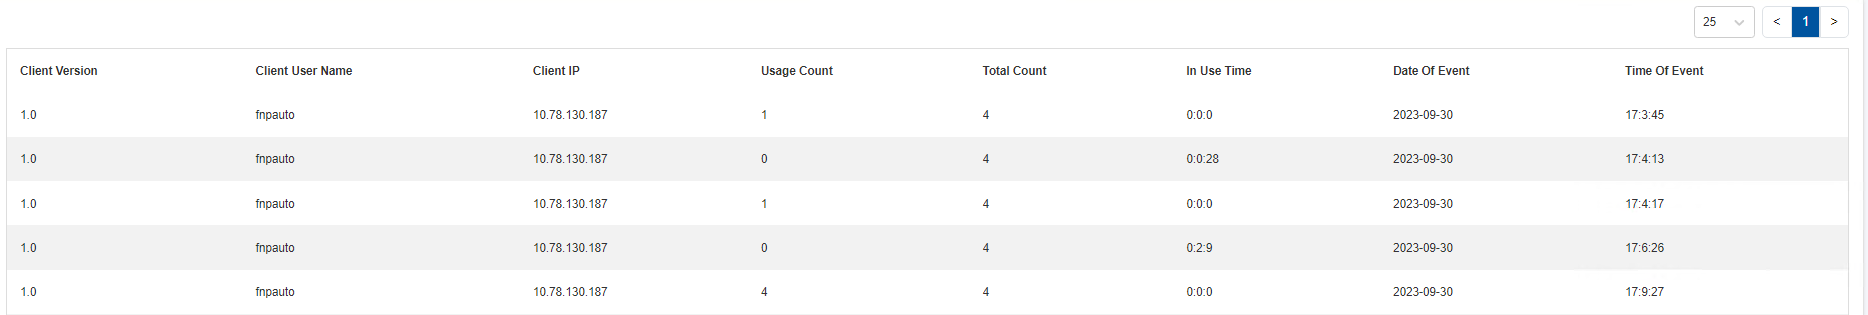
Data Beneath Graph
The following table describes the data as shown above:
|
Field |
Description |
|
Client Version |
Provides the version of client. |
|
Client User Name |
Indicates the user name of client. |
|
Client IP |
Provides the IP (Internet Protocol) of client. |
|
Usage Count |
Indicates number of licenses used in a particular interval. |
|
Total Count |
Indicates number of licences served by the license server. |
|
In Use Time |
Indicates time intervals during which the licenses were in checked-out status. |
|
Date Of Event |
Provides the date intervals at which events occured. |
|
Time Of Event |
Provides the time intervals at which events occured. |