Analyzing Debug Log Files on the Log Analysis Page
lmreporter is designed to analyze debug log files and present insightful graphs based on those uploaded debug log files. Follow the steps below to leverage this feature:
| • | Uploading Debug Log Files |
| • | Importing and Viewing Server Information |
| • | Generating Reports |
To initiate graph generation, you need to specify the location of the debug logs folder.
To upload debug log files:
| 1. | In the Import Log Files area of the Create Report page, specify or browse to the Log File Location. |
.
Figure 1: Upload Debug Log Files
| 2. | Click Import. |
Importing and Viewing Server Information
After you perform the steps in Uploading Debug Log Files and click Import, the following server information is displayed:
| • | First Start Date and Last End Date of the log |
| • | Vendor(s) (Vendor Daemon) name |
| • | License Server Host(s) name |
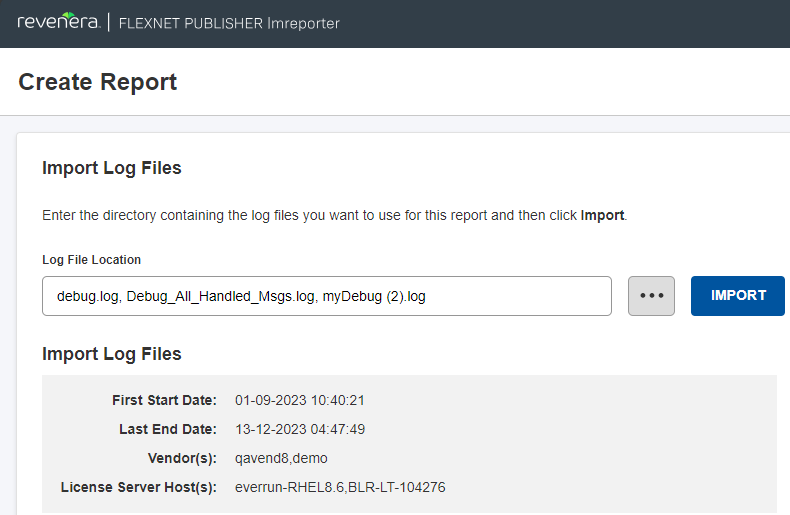
Figure 2: Server Information
To generate reports, perform the following steps.
To generate reports:
| 1. | After Uploading Debug Log Files, select a specific feature from the Select Feature With Usage list (if more than one is specified) and a vendor daemon from the Select Daemon list. |
The following screen shows selecting a specific feature from the Select Feature With Usage list:
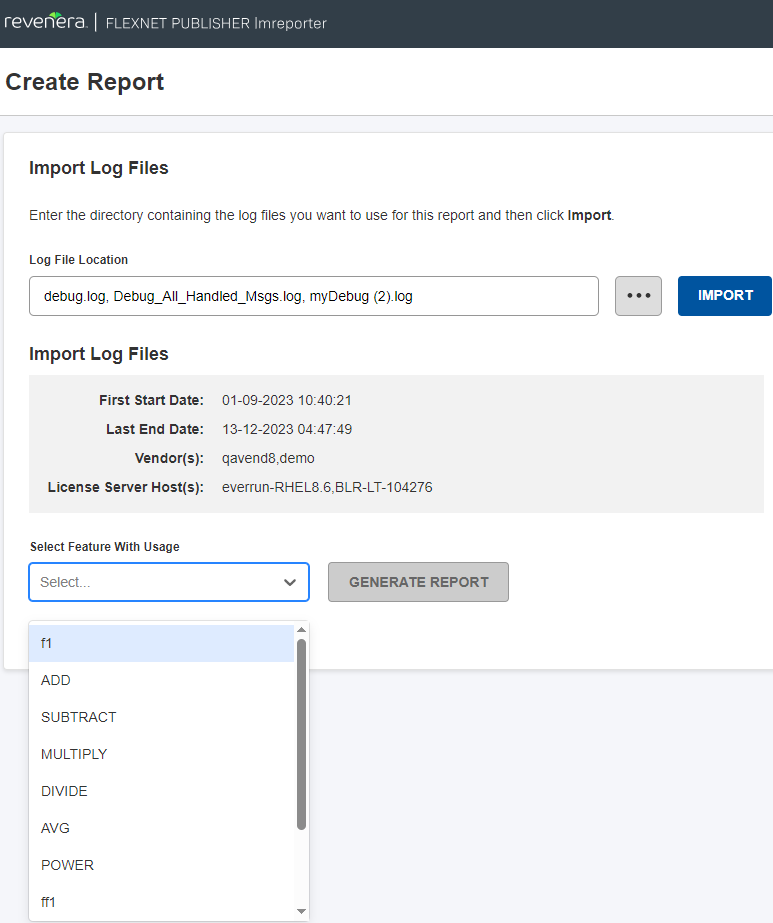
Figure 3: Select Feature With Usage Drop-Down
The following screen shows selecting a specific vendor daemon from the Select Daemon list:
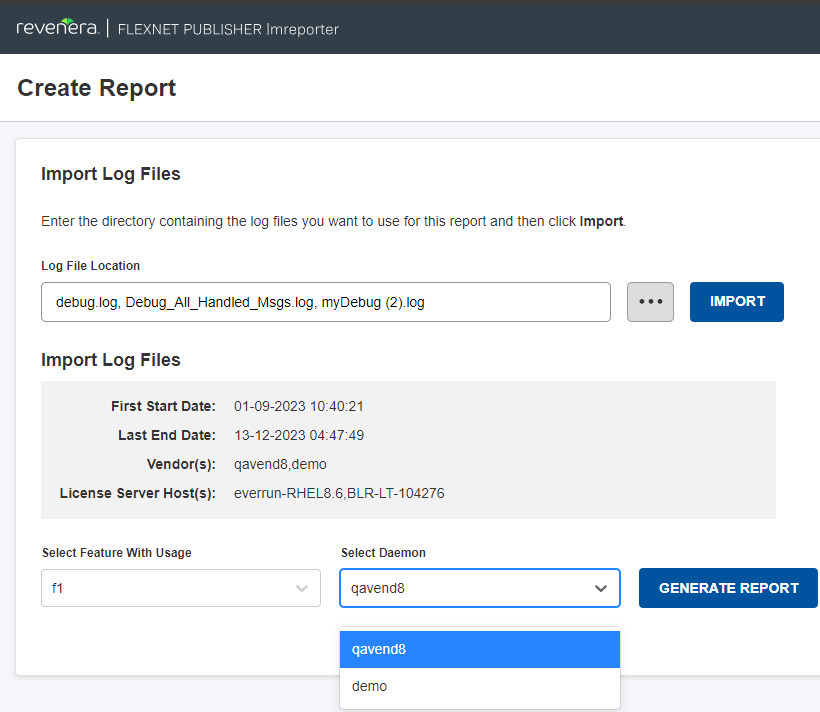
Figure 4: Select Daemon Drop-Down
| 2. | Click the Generate Report button to generate the report based on the selections. |