Viewing Highest Activity of a Feature on the Peak Usage Tab
The Peak Usage tab of the Feature Report provides a focused view of the highest activity or utilization of a selected feature on a selected day. It offers insight into the maximum usage reached for the chosen feature during that particular interval.
The following screen shows the bar graph representation of a selected feature peak usage over a specific interval on the Peak Usage tab.
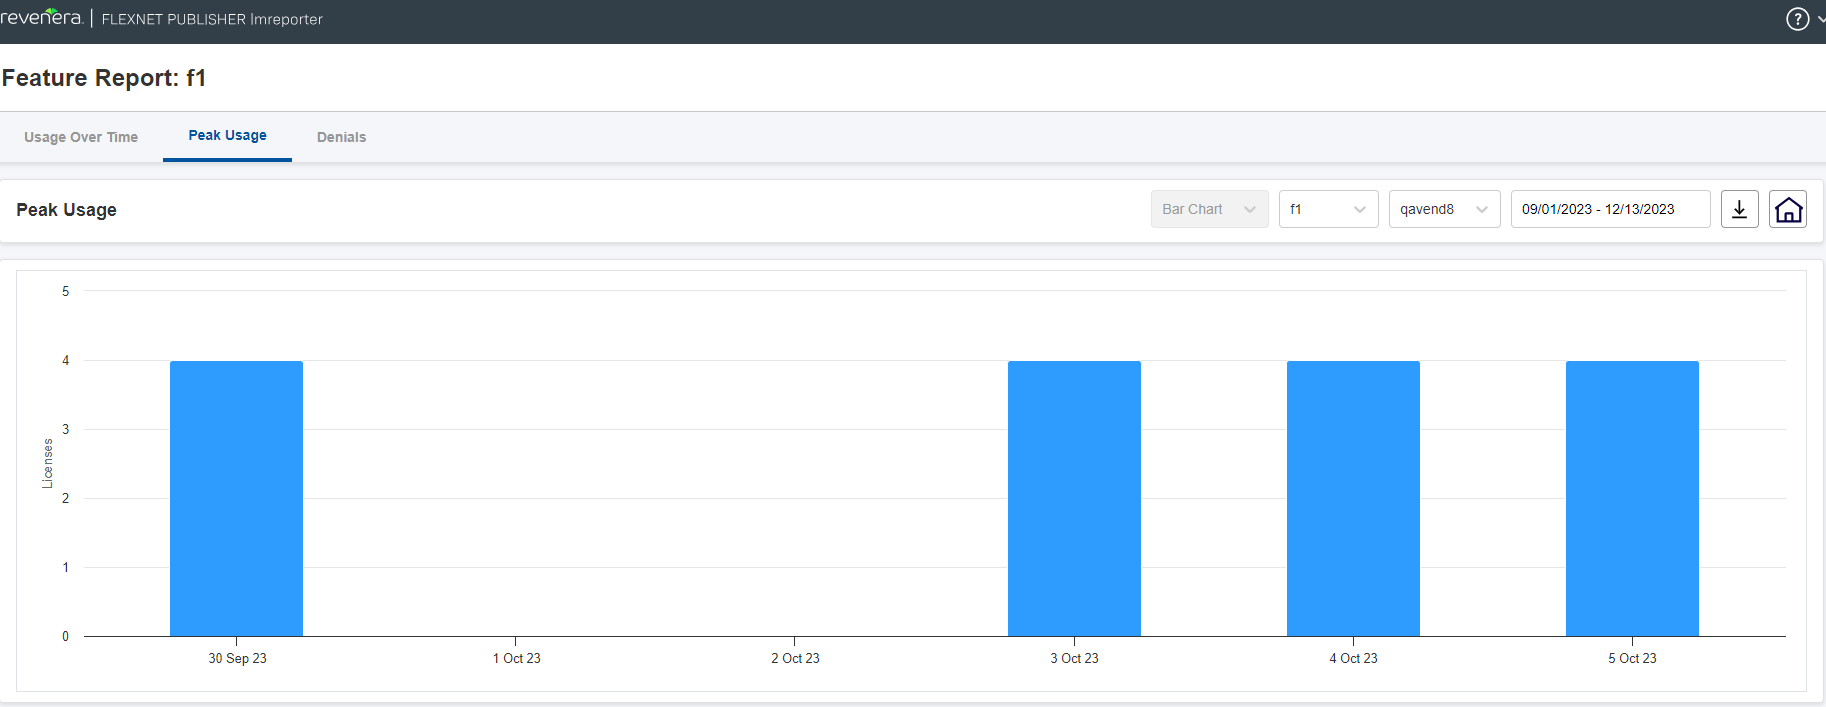
Figure 1: Peak Usage Tab
Key Features of the Peak Usage Tab
The following are the key features of the Peak Usage tab of the Feature Report:
| • | Day-specific focus—This tab concentrates on the peak usage of a selected feature for the selected day. |
| • | Feature-centric display—Users can quickly identify and analyze the highest point of activity for a selected feature. |
You can use the drop-down menus above the chart to select a different feature, vendor daemon, or date range.
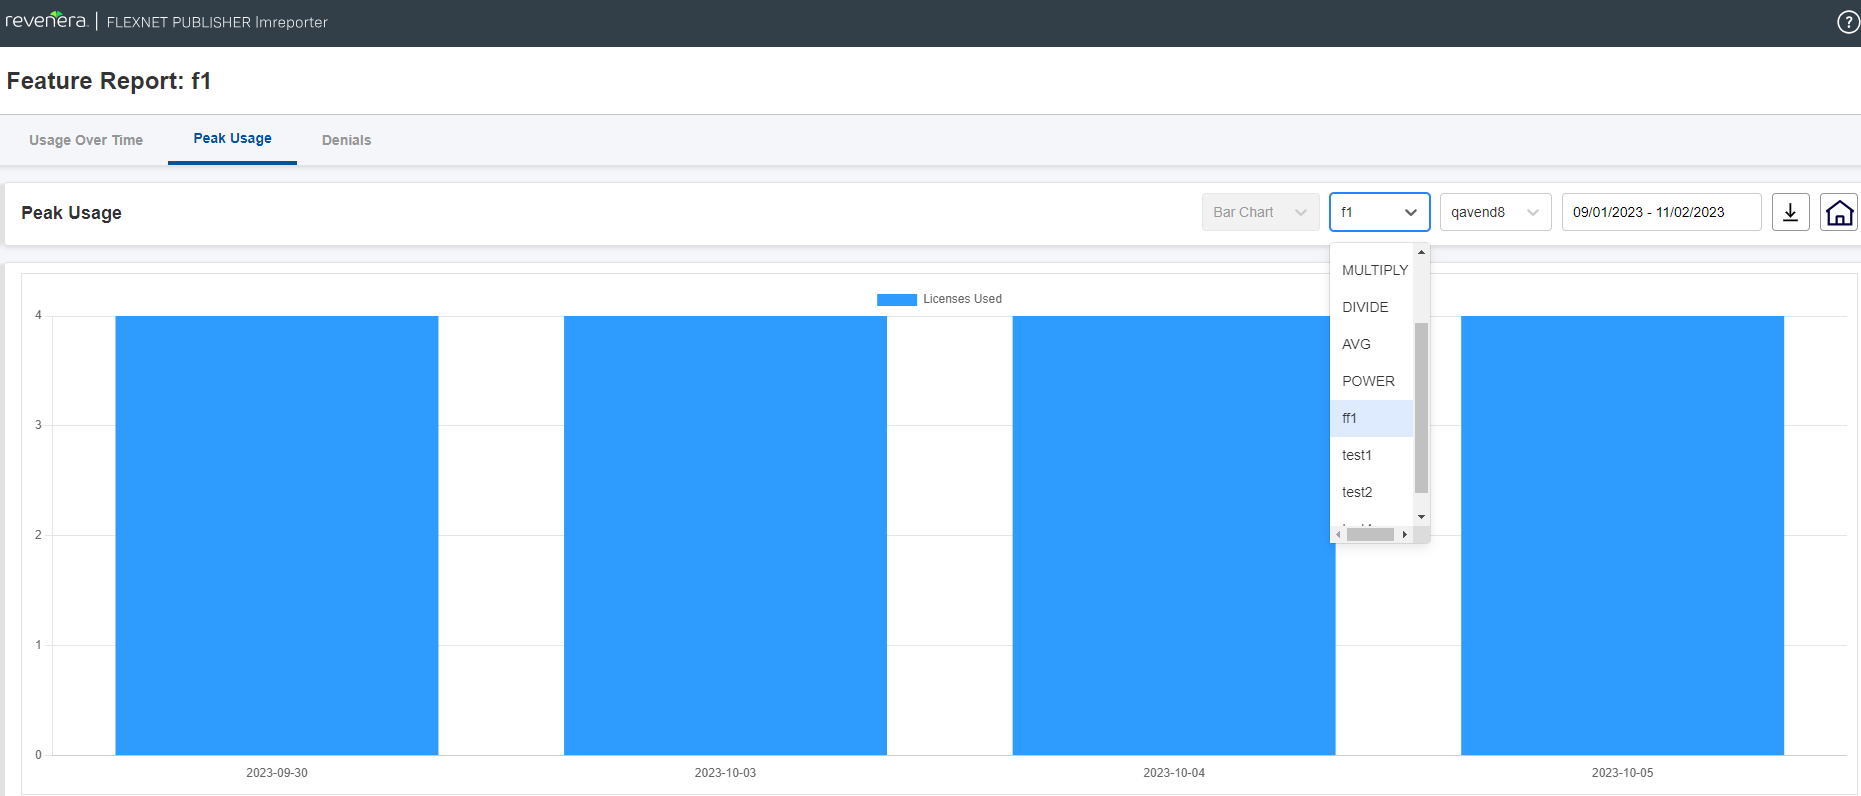
Figure 2: Peak Usage Tab with Feature Drop-Down
The following screen shows selecting a specific vendor daemon.
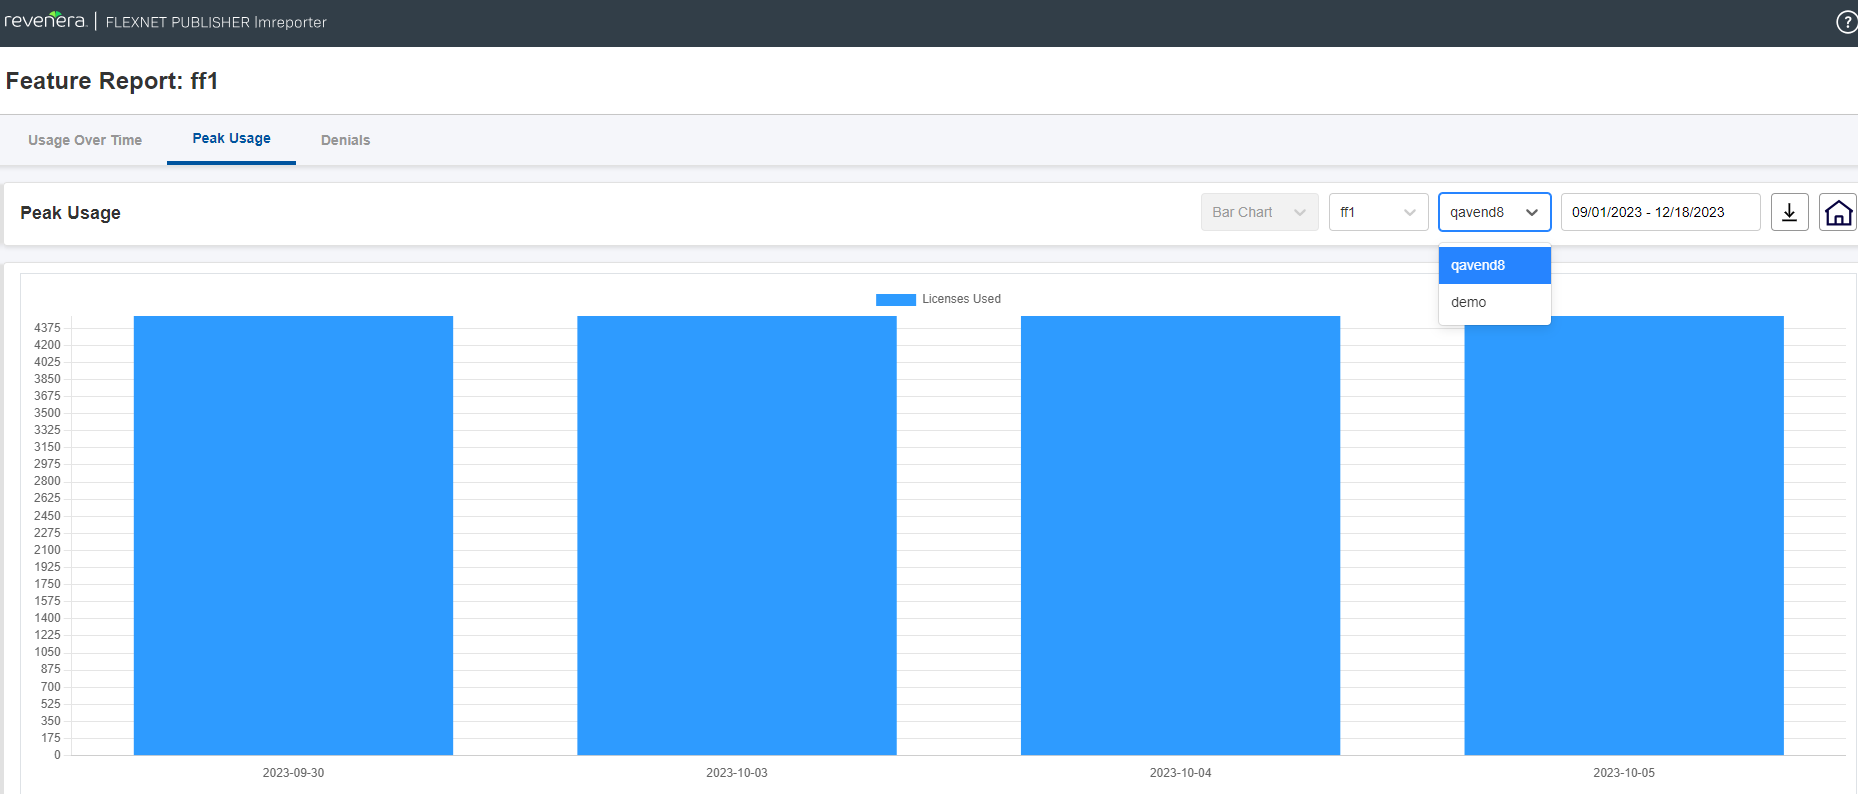
Figure 3: Peak Usage Tab with Vendor Daemon Drop-Down
The end user has the flexibility to choose the desired date range for the report creation.
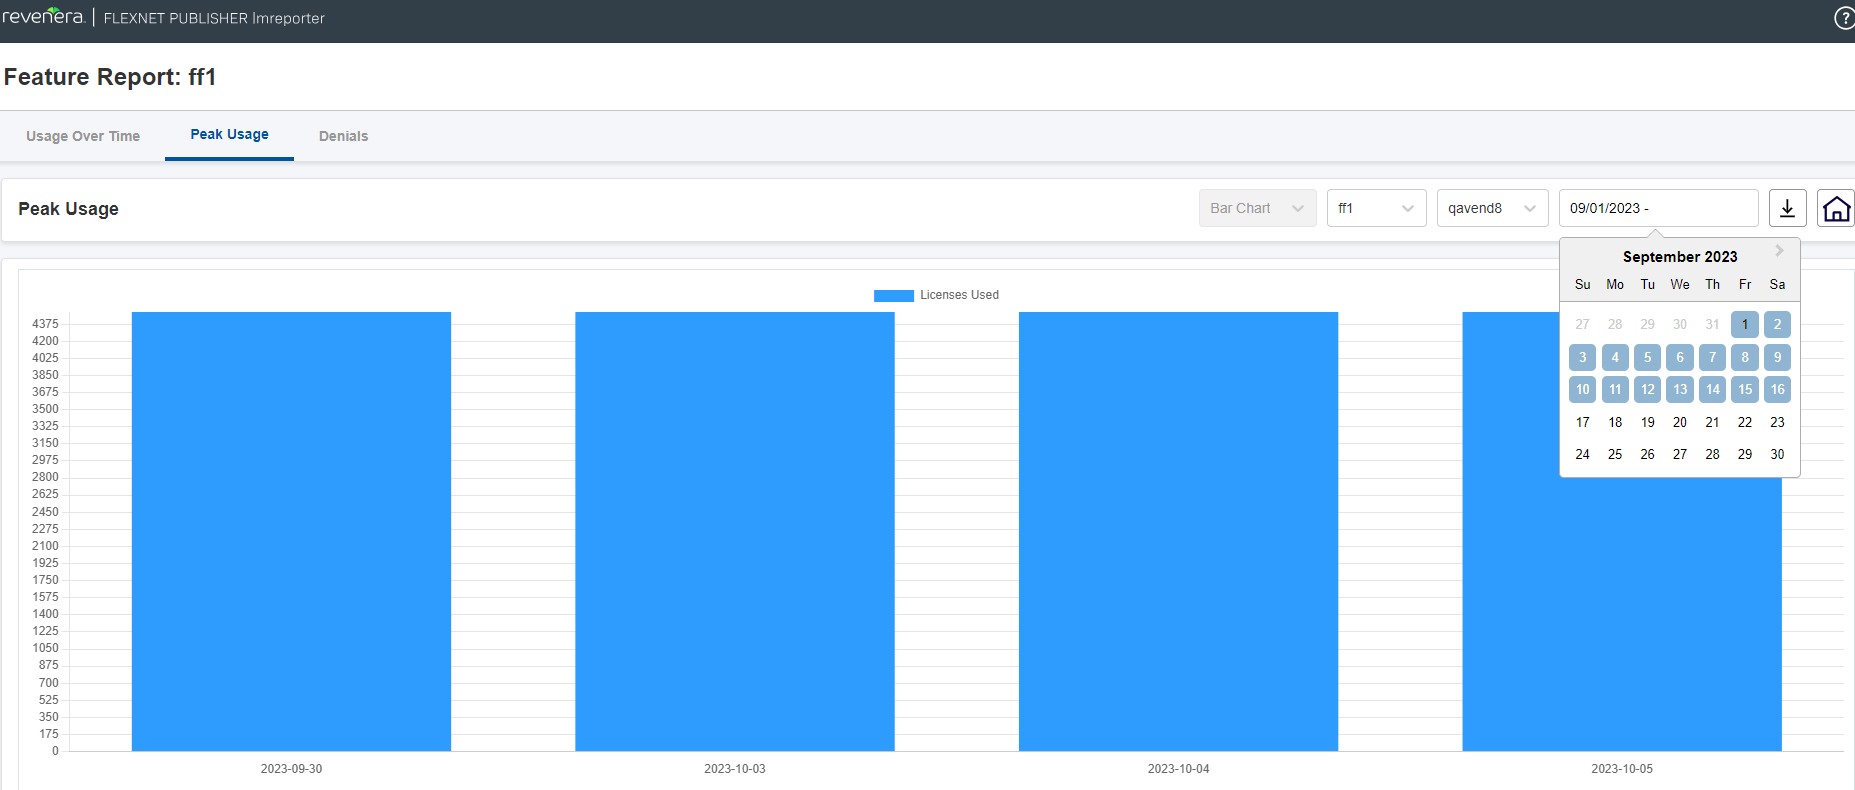
Figure 4: Peak Usage Tab with Date Range Selection