Using the Project Dashboard
FlexNet Code Insight 2019 R1
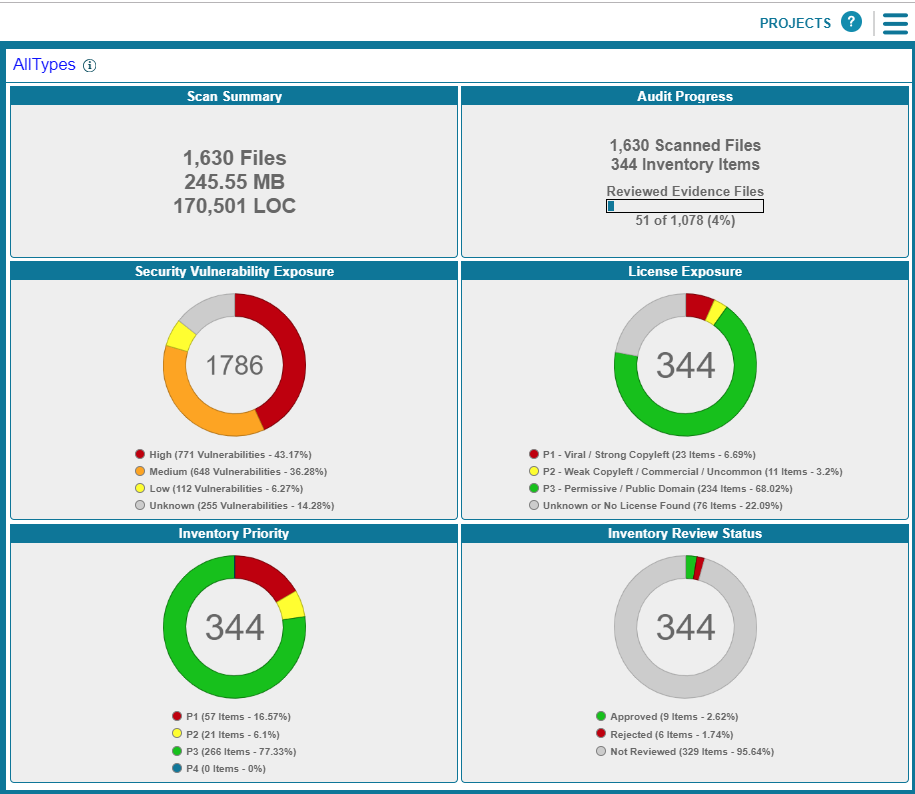
When you select a project from the Projects list, the Project Dashboard is displayed, providing you with an interactive view of your project, including security-vulnerability and license exposure, codebase and inventory review statistics, and other information.
The procedure that follows this image describes how to use Project Dashboard features.
To use the Project Dashboard, do the following:
|
2.
|
Select a project from the Projects list. The Project Dashboard for the selected project is displayed in the right panel. (Alternatively, hover over the project entry, and click its Load Project Dashboard icon  in the project entry to display the dashboard.) in the project entry to display the dashboard.) |
The Project Dashboard contains the following charts to provide an overview of the project’s most recent scan and the resulting inventory:
|
•
|
Scan Summary—A summary of your most recent scan, including number of files scanned, the size of the codebase/files, and the number lines of code. |
|
•
|
Audit Progress—A snapshot of the audit progress of the selected project. |
|
•
|
Security Vulnerability Exposure—An interactive color-coded chart and legend that provide an overview of the security vulnerabilities by severity across all the project inventory. The number in the center of the chart is the total number of security vulnerabilities found across all inventory items. |
|
•
|
License Exposure—An interactive color-coded chart and legend that provide an overview of the licenses identified by priority across all of the project inventory. The number in the center of the chart is the total number of inventory items identified for the current project. |
|
•
|
Inventory Priority—An interactive color-coded chart and legend that provide an overview of the priority of inventory in the selected project. For more information about inventory priority, see Inventory Priority. |
|
•
|
Inventory Review Status—An interactive color-coded chart and legend that show you the review status (Approved, Rejected, Not Reviewed) of the inventory for the selected project. |
|
3.
|
(Optional) Hover your mouse cursor over the color-coded segments in the charts to view details related to a given segment. If you want, click a color-coded segment to open the project to view the inventory items associated with the segment. See Filtering Inventory for a Project from the Project Dashboard for details. |
Alternatively, you can open the project to view all its inventory (see Opening a Project), or select another project from the Projects list to view its dashboard.
Open topic with navigation