Using the Project Dashboard
Code Insight 2021 R1
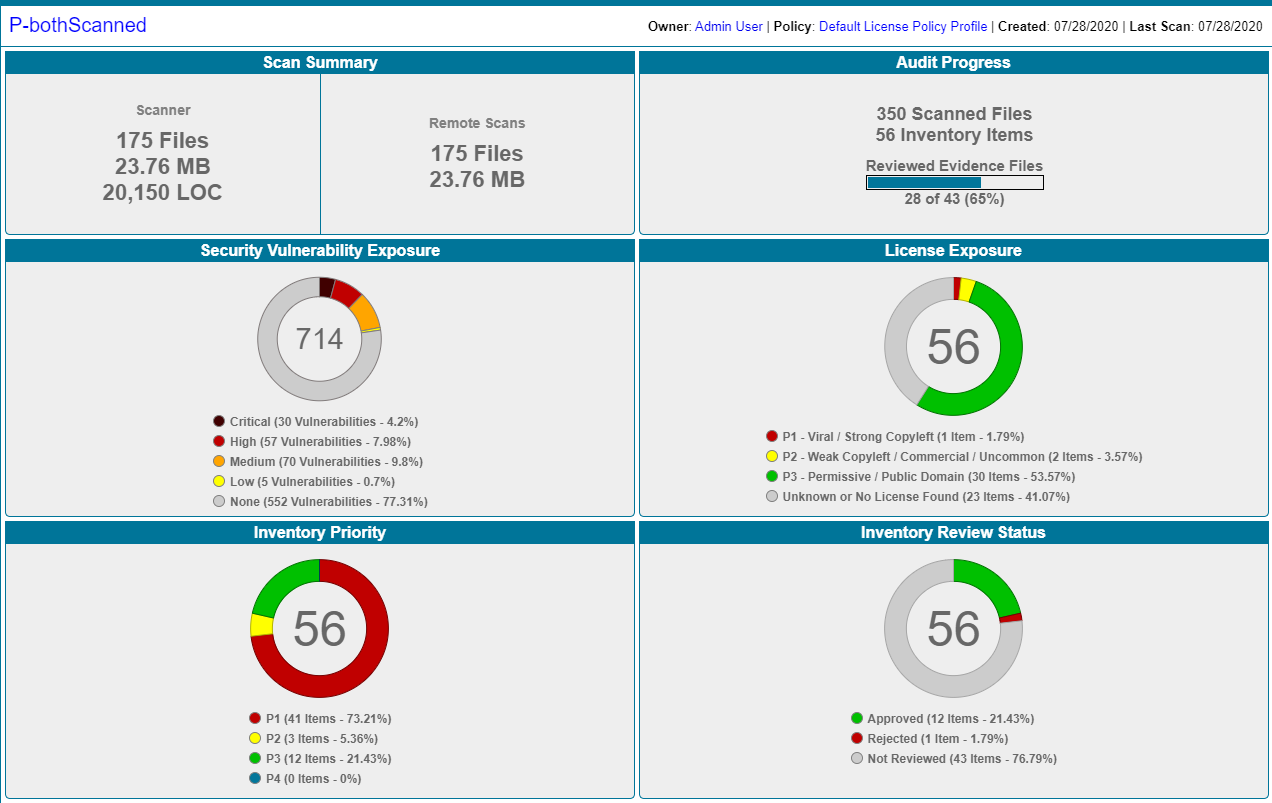
When you select a project in the Projects pane, the project’s dashboard is displayed, providing you with an interactive view of your project, including security-vulnerability and license exposure, codebase and inventory review statistics, and other information.
The procedure that follows this image describes how to use project dashboard features.
To use the project dashboard, do the following:
| 1. | Navigate to the Projects view. (See Opening the Projects View if additional instructions are needed.) |
| 2. | In the Projects pane on the left, click a project in the list of projects. The dashboard for the selected project is displayed in the right panel. (Alternatively, hover over the project entry in the list, and click the Load Project Dashboard icon  in the entry to display the dashboard.) in the entry to display the dashboard.) |
The project dashboard contains the following charts to provide an overview of the project’s most recent scan and the resulting inventory:
| • | Scan Summary—A summary of your most recent Scanner scan (that is, server scan) and most recent Remote Scans. If multiple scan-agent plugins are used for remote scanning, the Remote Scans summary shows totals from the most recent scans of all the agents. |
If only a server scan has occurred, the tile shows only Scanner totals. Likewise, if only remote scans have occurred, the tile shows only Remote Scans totals.
| • | Audit Progress—For a Scanner (server) scan, a snapshot of the audit progress that users have made on those files containing OSS or third-party evidence. No audit progress is shown for remote scans. |
The tile also shows the total number of scanned files and resulting inventory items for the project.
| • | Security Vulnerability Exposure—An interactive color-coded chart and legend that provides an visual of security vulnerability percentages and totals by severity across all project inventory. The number in the center of the chart is the total number of security vulnerabilities found in the inventory. (The colors in this chart can vary depending on the CVSS version Code Insight is using. See Security Vulnerabilities Associated with Inventory for details.) |
| • | License Exposure—An interactive color-coded chart and legend that provide an overview of the licenses by priority across project inventory. The number in the center of the chart is the total number of inventory items identified for the current project. |
| • | Inventory Priority—An interactive color-coded chart and legend that provide an overview of the percentages and totals of inventory priorities across all inventory in the current project. For more information about inventory priority, see Inventory Priority. |
| • | Inventory Review Status—An interactive color-coded chart and legend that provide a visual of the how many inventory items have been approved, rejected, or not reviewed in the project. |
| 3. | (Optional) Hover your mouse cursor over the color-coded segments in the charts to view details related to a given segment. If you want, click a color-coded segment to open the project to view the inventory items associated with the segment. See Filtering Inventory for a Project from the Project Dashboard for details. |
Alternatively, you can open the project to view all its inventory (see Opening a Project), or select another project from the list of projects in the Projects pane to view the dashboard for that project.