Filtering Analytics Data
Filtering enables you to focus on the portion of the data relevant to your analysis, affecting the data displayed in a report, visual or metric.
You manage report filters through the Filters pane, where you can refine existing filters or remove them entirely to view all available data.
The End-User Portal analytics experience supports multiple filtering mechanisms. This article focuses specifically on using the Filters pane. For details on interactive filtering between visuals, see Cross-Filtering and Cross-Highlighting of Visuals in a Report.
The Filters pane on the right side of the screen is the main area where you can see, control, and interact with all filters that have been set for the features in the Analytics menu.
The Filters pane is located on the right-hand side of the report. If the pane is collapsed, select Filters on the right edge of the screen to expand it.
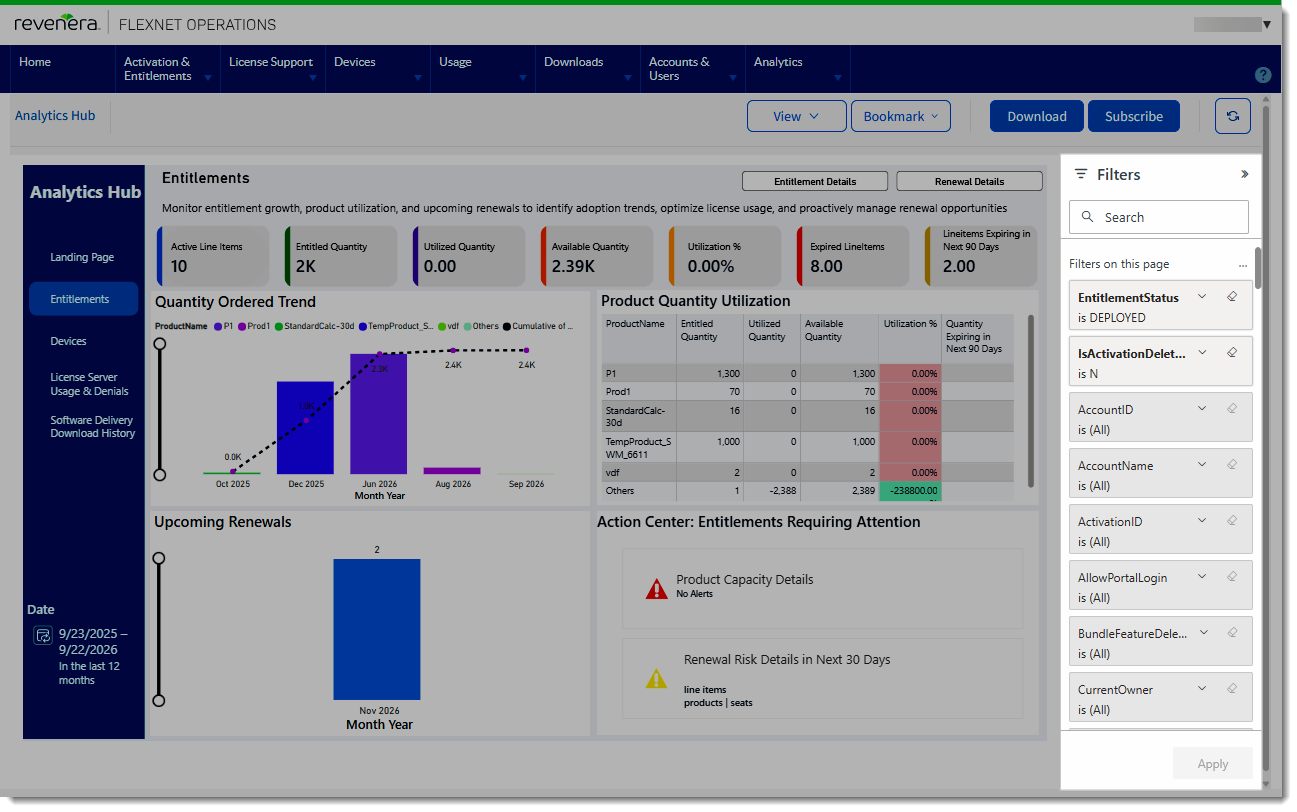
The Filters pane shows all filters available for the report. You can edit existing filters, but you cannot create new filters.
Filters are grouped into the following categories:
| • | Filters on this page—Apply only to the current page. |
| • | Filters on this visual—Apply only to a selected visual. |
Filter cards that appear shaded indicate that a filter is active and excluding some data. For example, a BusinessRegion filter set to APAC displays only APAC data and excludes EMEA, NA, and LATAM regions.
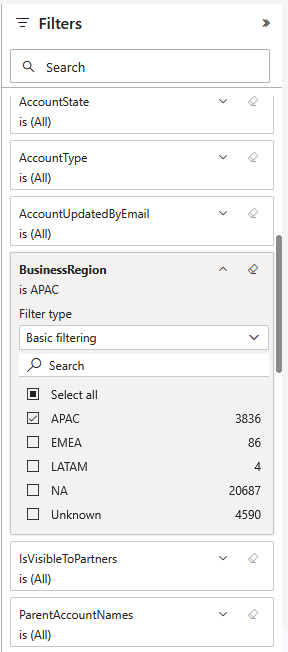
Example of a shaded filter
To see all filters affecting a specific visual, hover over the visual and click the Filter icon  . A pop-up appears showing all active filters applied to that visual.
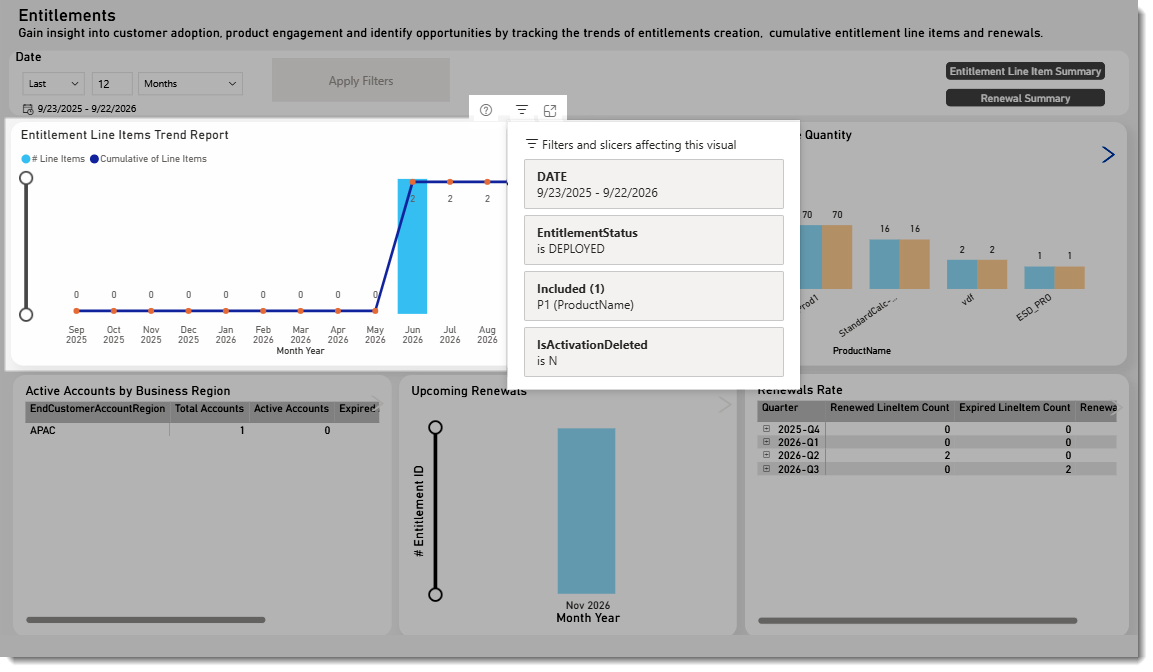
Filters affecting a specific visual can be displayed by clicking the Filter icon.
Modifying Filters in the Filters Pane
Filters can be applied either at the visual level or across the entire report page.-->
Viewing Filter Details
Select the down arrow next to a filter name to expand the filter card. This displays the available values along with their counts.
Applying a Filter
You can apply filters to a single visual or to the entire page.
To filter a specific visual, first select the visual. The Filters pane will then display a Filters on this visual section, listing filters that apply to that visual.
To apply a filter
| 1. | Select the down arrow next to the filter name to expand the filter card. |
| 2. | Select a filter type: |
| • | Basic Filtering—Displays a searchable list of all values in the field, allowing you to select one or more values. |
| • | Advanced Filtering—Uses conditional logic (such as contains, does not contain, starts with, or is greater than) to create more complex filter conditions. |
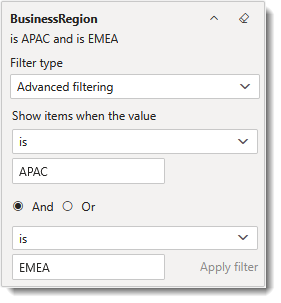
Example of an advanced filter focusing on business regions APAC and EMEA.
| 3. | For numeric or date fields, define ranges or conditions as needed. |
| 4. | If the filter contains many values, use the search box to quickly locate specific items. |
For basic filters, your filter criteria are applied immediately and the visuals on the page reflect the change. For advanced filters, click Apply filter to apply your filter criteria.
Clearing a Single Filter
You can reset an individual filter back to its default state.
To clear a single filter
| 1. | Select the down arrow next to the filter name to expand the filter card. |
| 2. | Select the eraser icon  next to the filter name to reset it to (All). next to the filter name to reset it to (All). |
Limiting Data for Visuals
You can apply a data limit to filters at the visual level. Data limits restrict the number of rows loaded into a visual, which can improve performance by reducing processing time for large datasets.
To apply a data limit on a visual
| 1. | In the Filters on this visual section, click the three dots (More options). |
| 2. | Select Add data limit to display the Data limit filter card. |
| 3. | Enter a value for the data limit and click Apply filter. |