Downloads Tile
The Downloads tile shows the total number of downloads created in the past 12 months.
Analyzing Download Graphs
The monthly trend in software downloads offers valuable insights into adoption patterns over time:
| • | A spike in downloads may reflect increased customer interest, measures the impact of product launch for sales and marketing. |
| • | By applying the right filters—such as product line, download package, or geography—Product Management can gain deeper visibility into how specific offerings are performing across different regions. |
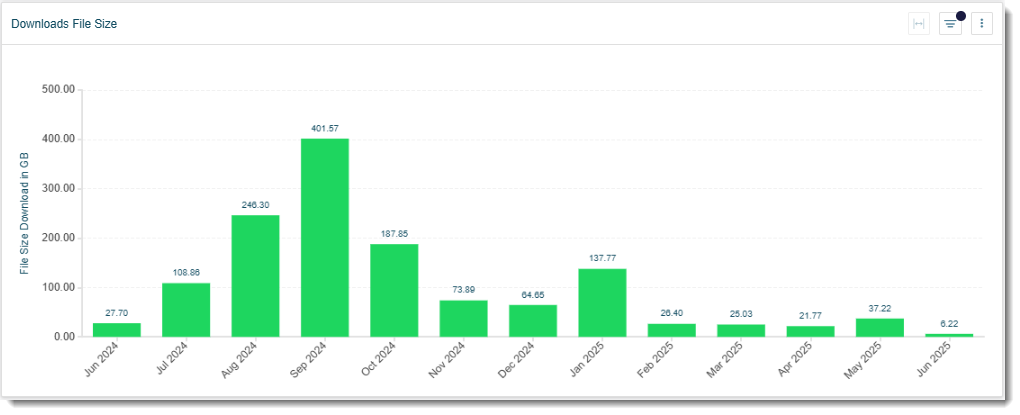
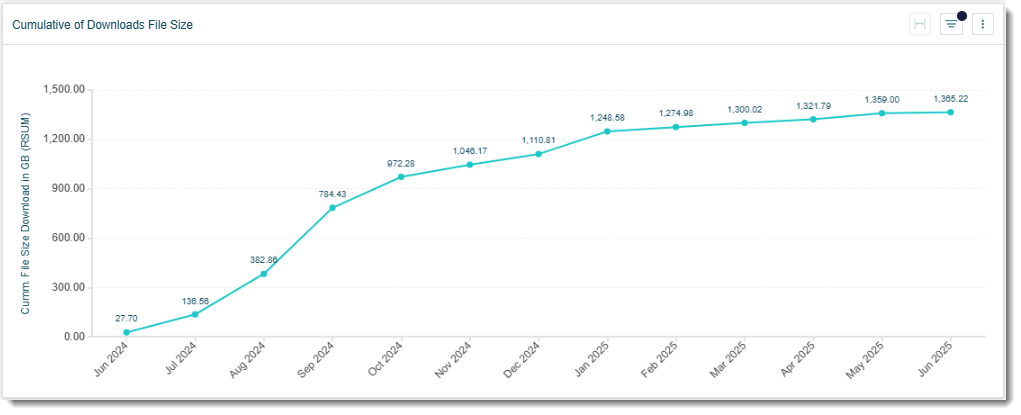
The file size trend over the past 12 months offers insights into storage utilization. An upward trend may indicate the need for producers to either optimize their storage usage to reduce costs or consider upgrading to accommodate growing storage demands.
Quick Filters for Users
DOWNLOAD_END_DATE (dynamic options available, such as, today, yesterday, last 7 days, last 30 days, current month and previous month)
Visualizations for Users
Click the Downloads tile to access the following visualizations:
| • | Monthly Trend Bar Chart “Downloads Trends”—Shows the number of completed downloads per month for the last 12 months. |
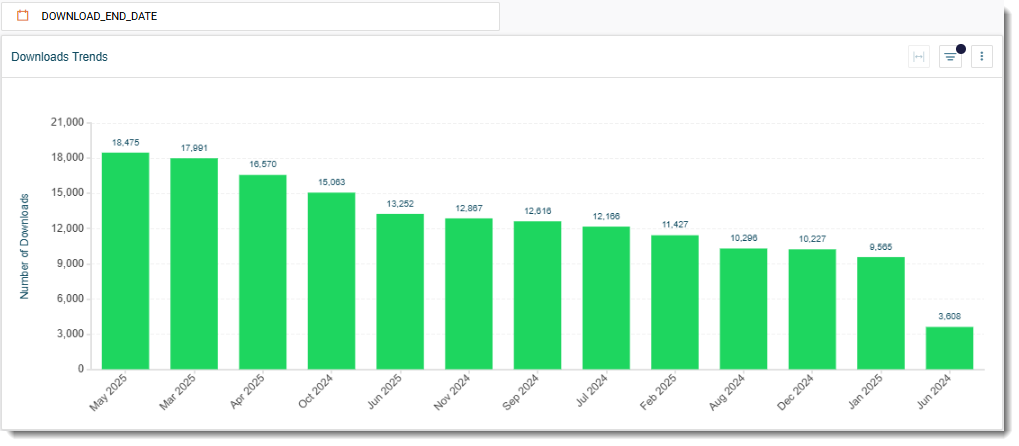
Tip:Click a bar in the bar chart to show the data for a particular month. The other graphs and table on the page will automatically apply the same filter.
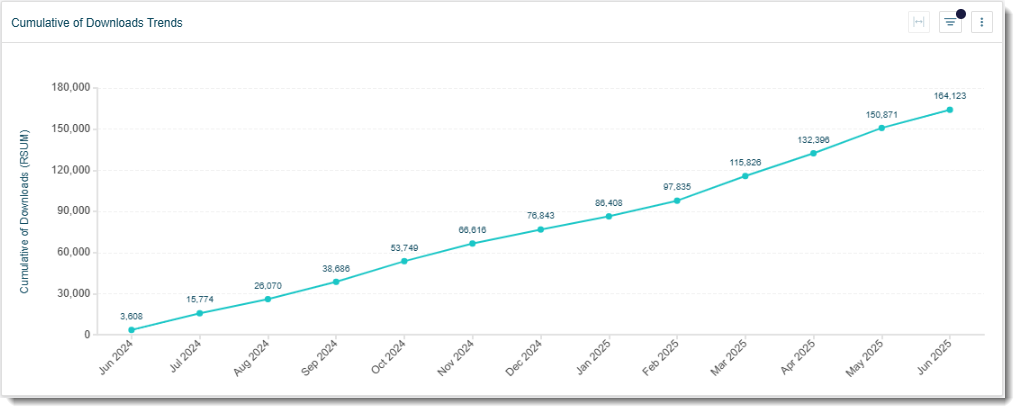
| • | Line Chart “Cumulative of Downloads Trends”—Helps track the number of downloads completed for the last 12 months. |
| • | Bar Chart “Downloads File Size”—Represents file size downloaded in GB over the past 12 months. |
| • | Line Chart “Cumulative of Downloads File Size”—Visualizes the growth of downloads. |
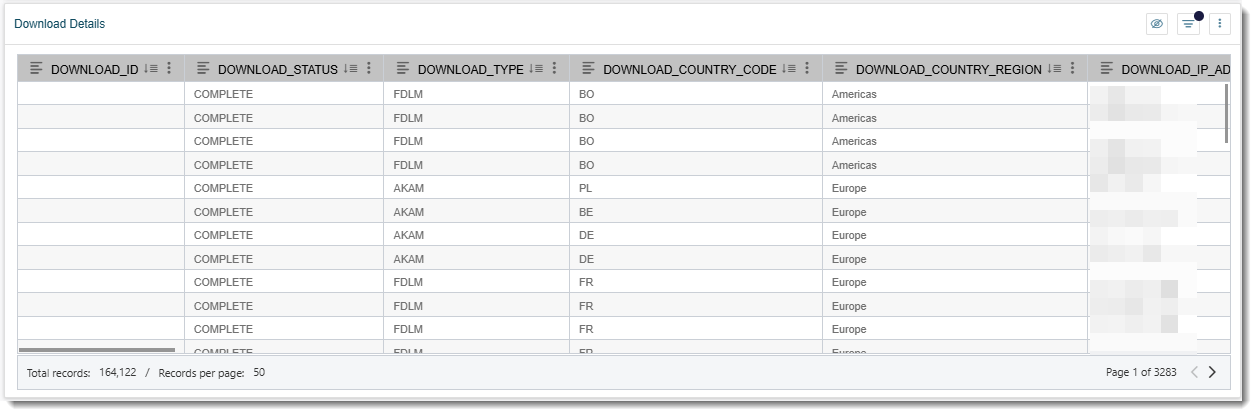
| • | Table “Download Details”—Offers detailed insights for operational and strategic follow-up. |