Entitlements Tile
The Entitlements tile displays the total number of entitlement line items created in the past 12 months.
Analyzing Entitlements Graphs
Tracking the trend of entitlements created each month (see chart “Entitlement Line Items”) and cumulative entitlement line items (see chart “Cumulative Entitlement Line Items”) provides visibility into customer adoption and product engagement.
Filtering entitlements by account helps identify how individual customers are adopting your product. This enables your Customer Success and Operations teams to:
| • | Tailor engagement strategies. |
| • | Identify accounts needing support. |
| • | Identify upsell opportunities. |
| • | Monitor onboarding effectiveness. |
Analyzing entitlements by product or product line gives Product Management insights into:
| • | Which offerings are gaining traction. |
| • | Which products may need repositioning or enhancement. |
| • | Opportunities to refine pricing, packaging, or feature bundling. |
Quick Filters for Entitlements
| • | Created On (dynamic options available, such as, today, yesterday, last 7 days, last 30 days, current month and previous month) |
| • | End Customer Account ID |
Visualizations for Entitlements
Click the Entitlements tile to access the following visualizations:
| • | Monthly Trend Bar Chart “Entitlement Line Items”—Shows the number of new entitlement line items created each month during the last 12 months. |
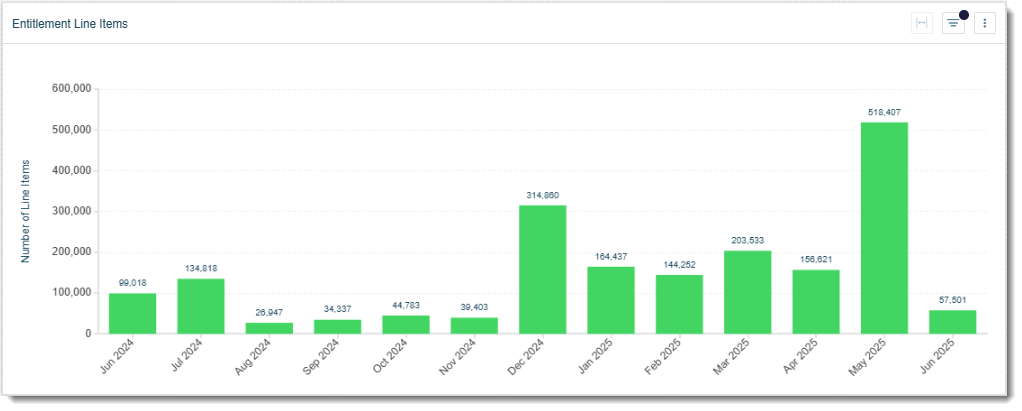
Tip:Click a bar in the bar chart to show the data for a particular month. The cumulative line graph and table will automatically apply the same filter.
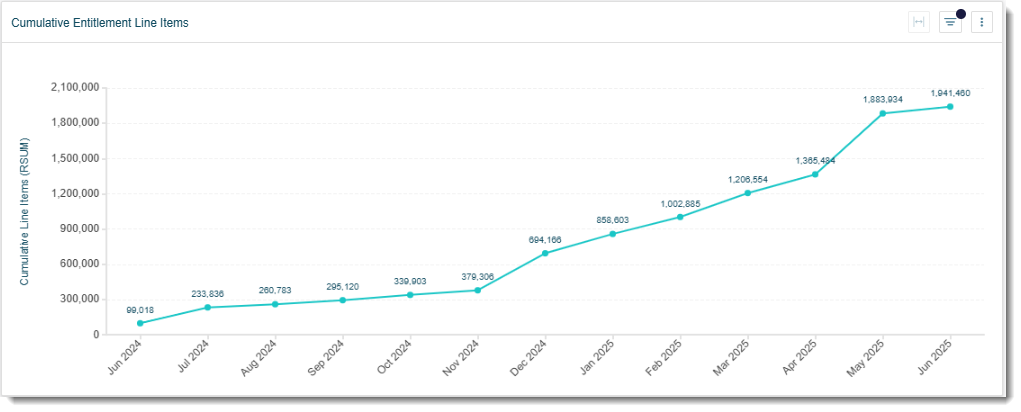
| • | Cumulative Line Graph “Cumulative Entitlement Line Items”—This line graph of total entitlements highlights long-term growth patterns or plateaus. |
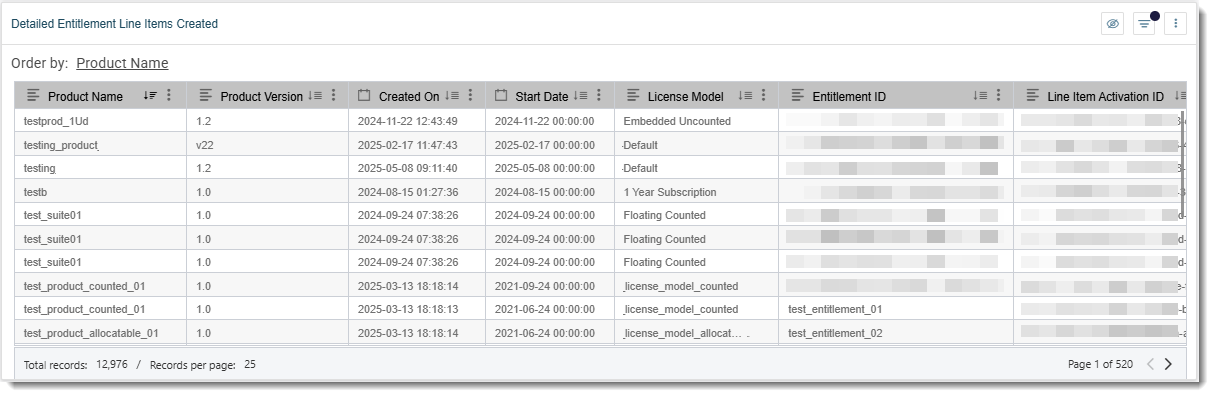
| • | Table “Detailed Entitlement Line Items Created”—Provides raw data for auditing, reporting, and deeper analysis. |