Users Tile
The Users tile shows the total number of users created in the past 12 months.
Quick Filters for Users
| • | Created Date (dynamic options available, such as, today, yesterday, last 7 days, last 30 days, current month and previous month) |
| • | Account ID |
Visualizations for Users
Click the Users tile to access the following visualizations:
| • | Pie Chart “User Accounts”—Shows a breakdown of user types. User types are grouped into: |
| • | Customer users |
| • | Self-registered users |
| • | Partner users |
| • | Publisher users |
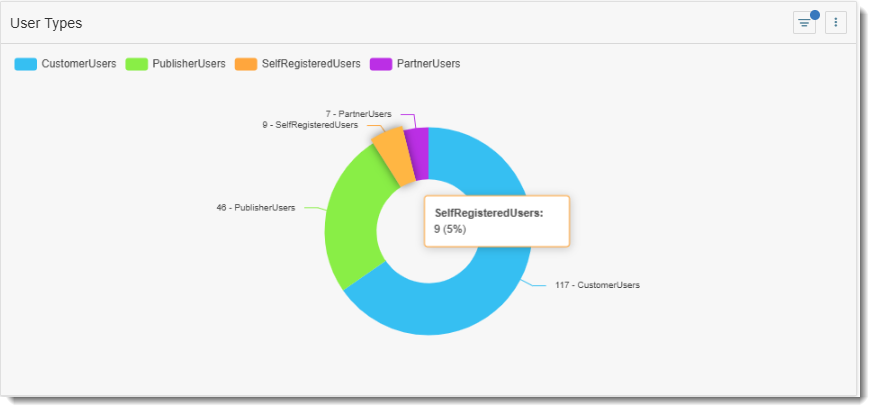
Tip:Click an area in the doughnut chart to focus on a particular user type. The filter you choose will also be applied to all other charts and the table on this page.
| • | Monthly Trend Bar Chart “User Trends”—Shows the number of new users created each month during the last 12 months. |
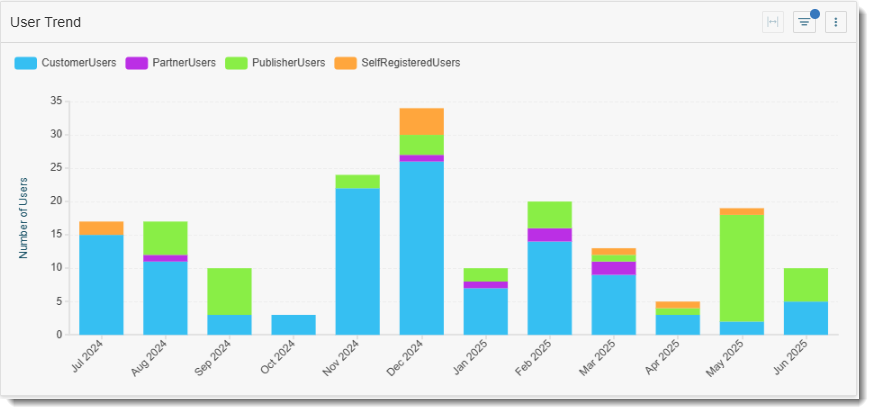
Tip:Click a bar in the bar chart to show the data for a particular month. The other graphs and table on the page will automatically apply the same filter.
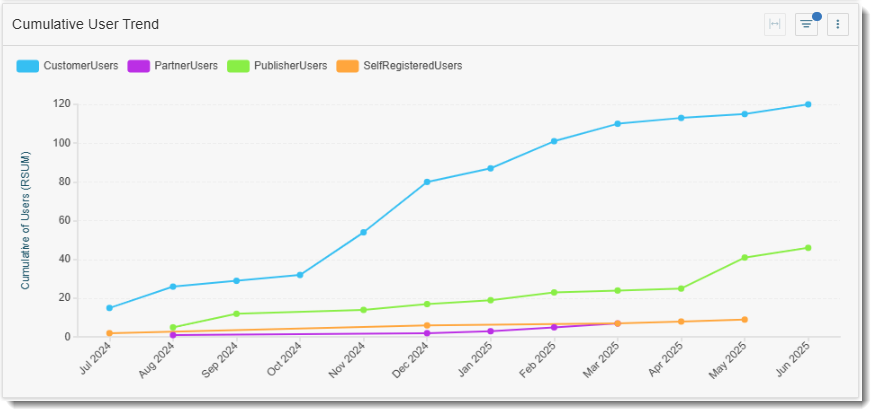
| • | Cumulative Line Graph “Cumulative User Trend”—Helps track net growth and retention of active users over time. |
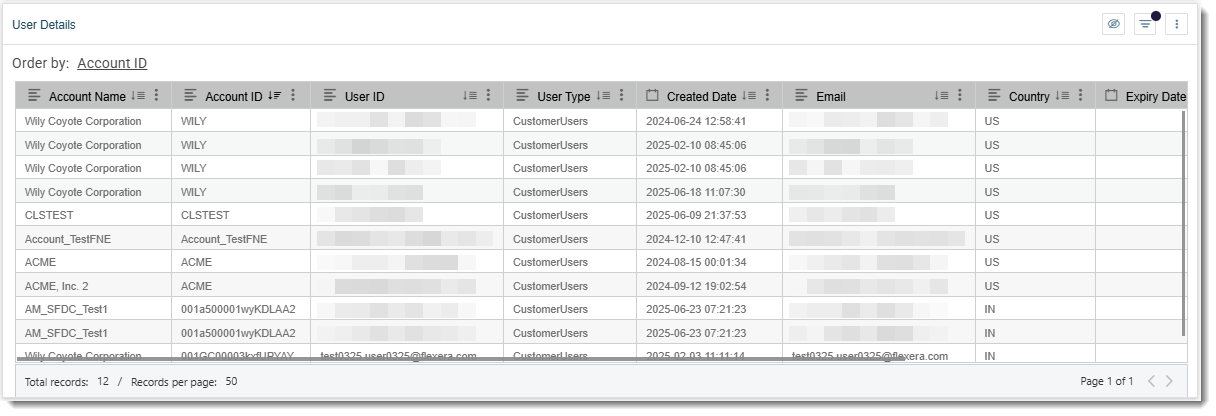
| • | Table “User Details”—Offers detailed insights for operational and strategic follow-up. |