Dynamic Monetization Usage and Denials Report

The Dynamic Monetization Usage and Denials report provides insights into the usage of items that are monetized dynamically. The report shows how often items are used and how that usage translates into revenue.
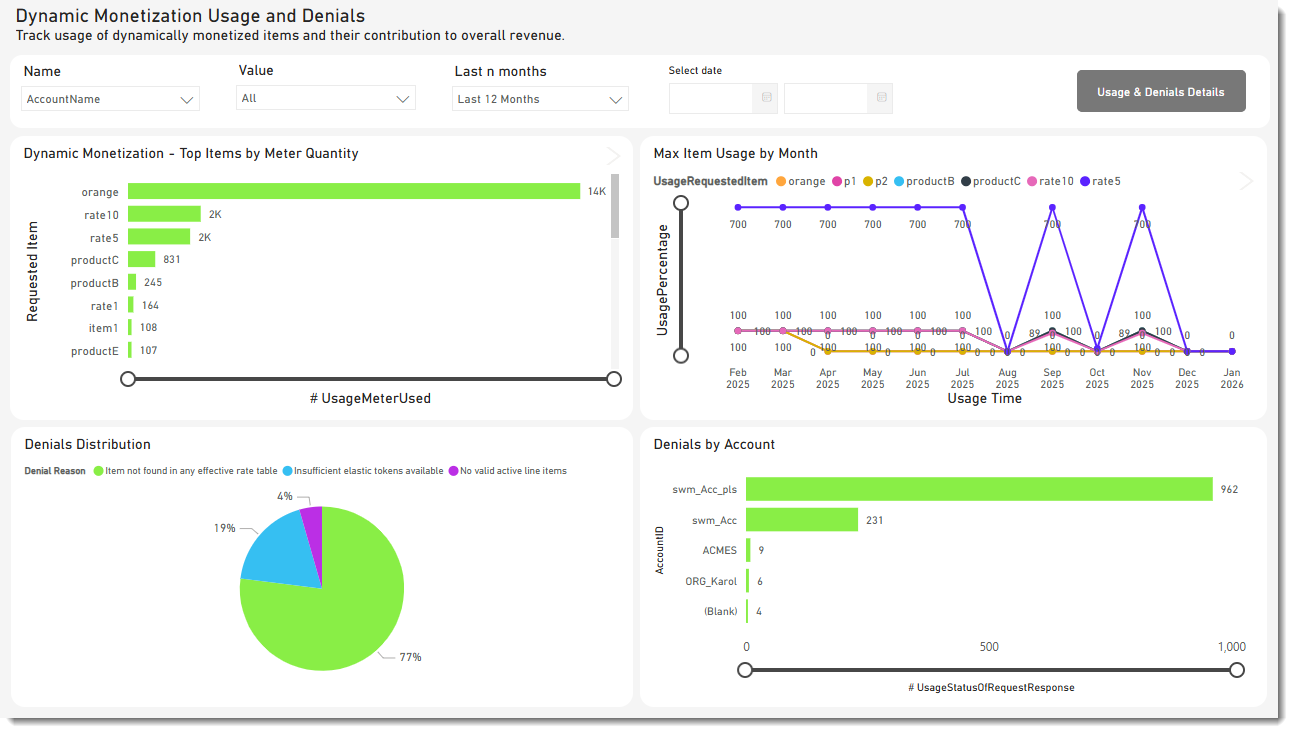
Note:Some of the terminology in this report might not be familiar for all users:

“ENTITLED_ARTICLES” refers to products.
“ITEM” refers to features.
“ITEM_VERSION” refers to the feature version.

Note:You can filter the charts or tables in the Dynamic Monetization Usage and Denials report using the widget filter at the top of each chart or table:

Dynamic Monetization - Top Items by Meter Quantity

The Top Items by Meter Quantity chart shows the most popular items requested using Dynamic Monetization. This chart helps producers identify the items that are most popular among all accounts.

Max Item Usage by Month

Shows usage data for all items aggregated by month. Click the item name at the top of the chart to select or deselect items to be included in the chart.

All Events Listing for Dynamic Monetization

Shows usage data of items that are monetized dynamically. The table lists each occurrence of an item being requested along with its usage data.