Denials Distribution
The Denials Distribution report analyzes the denials made by a Cloud Licensing Service (CLS) instance, Dynamic Monetization instance or a local license server and provides insights into causes and patterns where requests to access licensed software were rejected. The report reveals details about:
| • | Denial reasons—Reasons are grouped by the denial status code, along with the percentage distribution per denial code. Identifying the most common reasons for denials—such as, for example, insufficient feature counts or elastic tokens, expired features, features not available due to rule rejection—allows you and your customer to take corrective action. |
| • | Denial patterns—Discover which accounts are experiencing the most denials. This information helps you uncover key accounts that might not be sufficiently provisioned with licenses to meet their day-to-day operational requirements. |
| • | Denial trends—Patterns in denied requests can help you forecast future demand for certain features, products, or license types. This insight supports better resource allocation, product development, and infrastructure planning to meet anticipated growth. |
The Denials Distribution report includes the following charts and tables.
|
Chart or Table |
Chart or Table Title |
Description |
|
Chart |
Pie chart visualizing the percentage distribution of denial reasons. |
|
|
Bar chart visualizing the accounts that most frequently experienced denials. |
||
|
Table |
Detailed denials data across all accounts, license server instances and denial reasons. |
Note:You can filter the charts or tables in the Denials Distribution report using the widget filter at the top of each chart or table: 
For a use case example describing how the Denials Distribution report can benefit you, see Example 4: Identify Common Denial Reasons and Take Corrective Action.
The Denials Distribution pie chart visualizes the different types of denials along with their percentage distribution, providing insights into denial patterns. Hover over a pie slice to see the following information:
| • | Denial status code and description |
| • | Absolute number of denials |
| • | Percentage of denials |
You can filter the pie chart using the using the widget filter at the top, to focus on specific denial status codes, accounts, or other criteria.
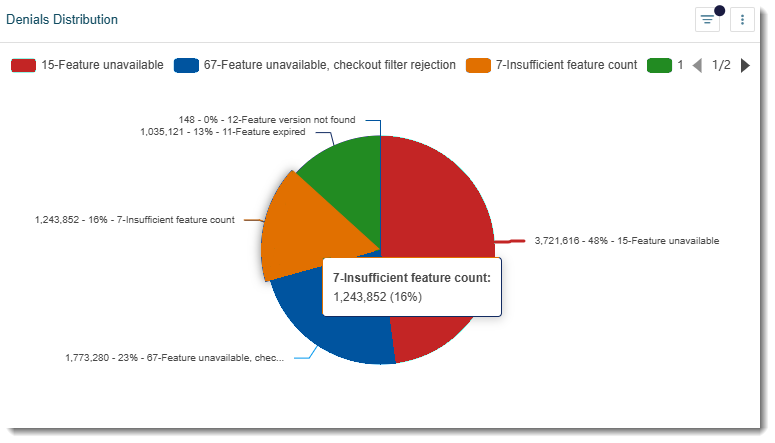
Example of a Denials Distribution pie chart
The Denials by Account bar chart shows the denials segmented by account, offering valuable insights into the key accounts that should be prioritized for revenue generation opportunities.
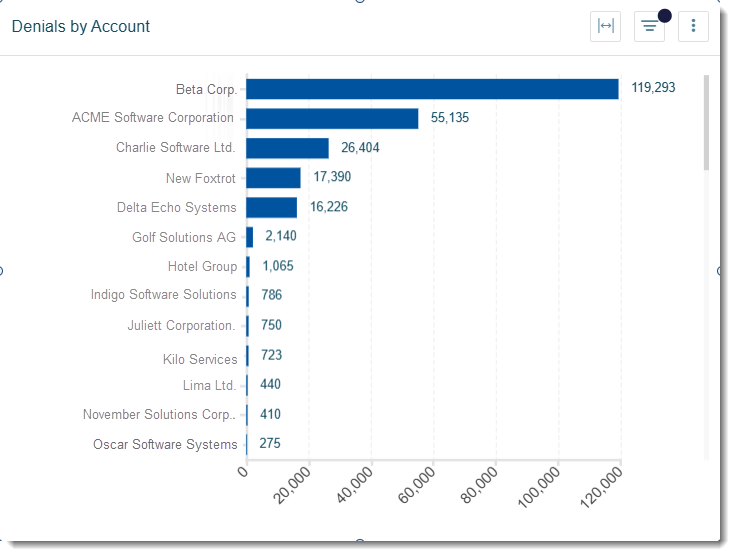
Example of a Denials by Account bar chart
The Denials Summary table offers detailed insights into denials, showing data such as users/clients, features and timestamp, enabling data-driven conversations with customers.