Visuals in the License Server Usage & Denials Report
On its main page, the License Server Usage and Denials report presents the following visuals, giving an overview of the license usage data based on the license type and an overview of denied requests.
| • | Active Account Identifiers (Total Number of Events) |
| • | Number of Unique Served Clients |
| • | Activations by Product |
| • | Denials Distribution |
| • | Denials by Account |
Note:By default, the visuals for this report cover data for the last 12 Months from the current date. Edit the filter if you require a different date range.
Active Account Identifiers (Total Number of Events)
This chart presents the accounts with the highest number of transactions for licenses. A transaction, or licensing event, is any activity that involves the interaction between a license server and a client, such as requesting, granting, or denying a license.
The x-axis displays the number of events that were recorded for each account in the last 6 months.
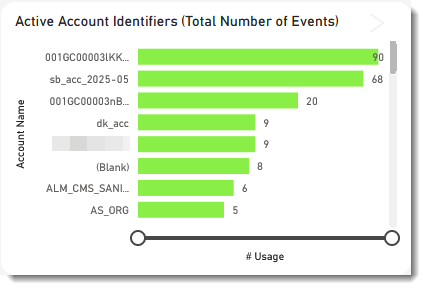
Example of the Active Account Identifiers chart in the License Server Usage & Denials report.
Tip:Filter by license model (concurrent or metered) to get an overview of the license usage data based on the license type and an overview of denied requests.
More Actions
Drill down into an account to see transactions for a specific account.
Number of Unique Served Clients
This chart shows the number of clients that used certain features over a specified period (default: 6 months). It delivers the licensing data that helps product and sales managers develop optimal product pricing and packaging strategies.
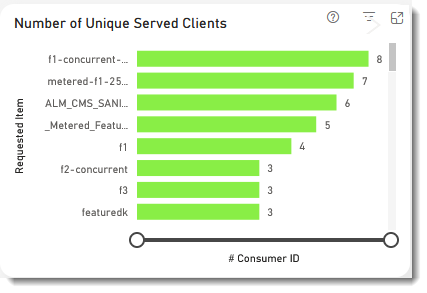
Example of the Number of Unique Served Clients chart in the License Server Usage & Denials report.
This bar chart shows the number of active activations, grouped by product.
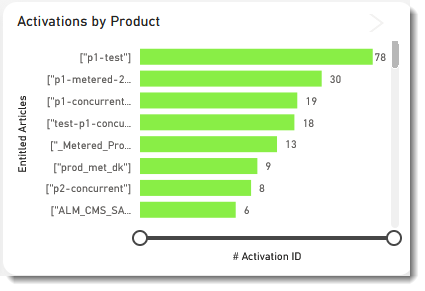
Example of the Activations by Product chart in the License Server Usage & Denials report.
The Denials Distribution pie chart visualizes the different types of denials along with their percentage distribution, providing insights into denial patterns. Hover over a pie slice to see the following information:
| • | Denial reason |
| • | Absolute number of denials |
| • | Percentage of denials |
You can filter the pie chart using the using the widget filter at the top, to focus on specific denial status codes, accounts, or other criteria.
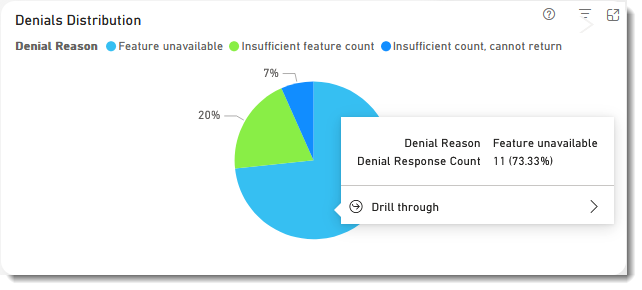
Example of the Denials Distribution pie chart in the License Server Usage & Denials report.
The Denials by Account bar chart shows the denials segmented by account, offering valuable insights into the key accounts that should be prioritized for revenue generation opportunities.
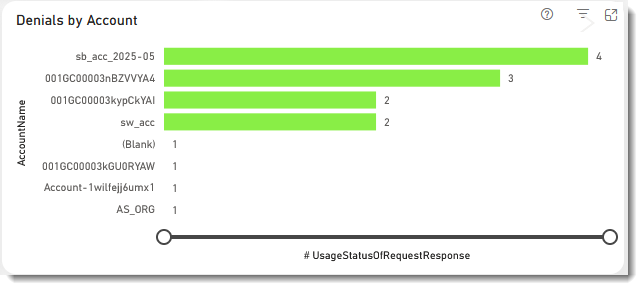
Example of the Denials by Account bar chart in the License Server Usage & Denials report.