Displaying Summary Tables for Reports
FlexNet Operations Analytics provides both high-level visual insights and detailed data views for every report. Each report includes one or more Summary buttons that correspond to the data presented in the main reports page and visuals. For example, the Accounts & Users report displays the Account Summary and User Summary buttons.
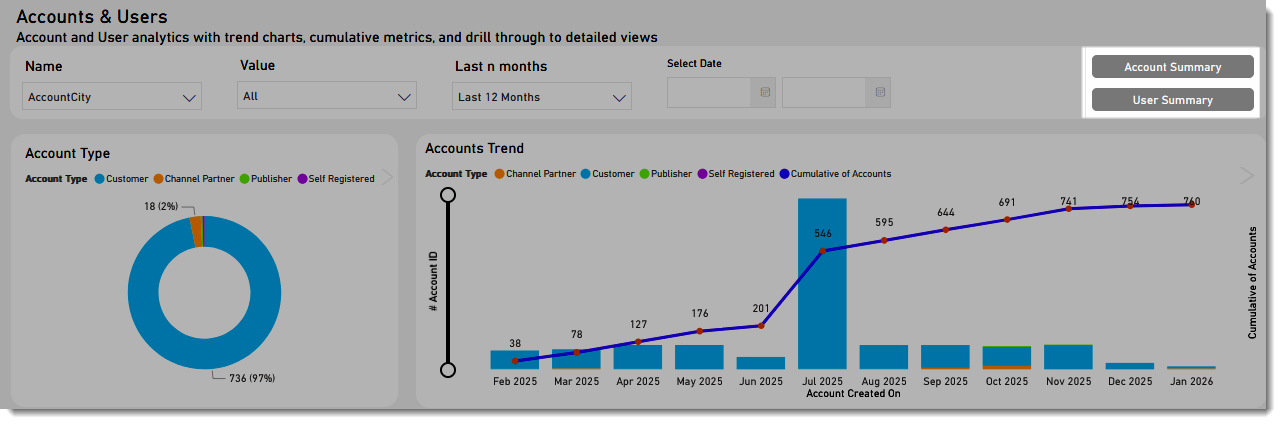
The Summary buttons are displayed in the top right area of each report.
When a user selects one of these buttons, FlexNet Operations opens a corresponding summary page. Unlike the main report pages—which display charts, graphs, and other visualizations—the summary pages present the underlying data in a tabular format. These tables expose the full dataset used to generate the visualizations, allowing users to review individual records, examine specific fields, and export or filter the information as needed.
See also Working in Tabular View.