Viewing Modes
You can view Web Intelligence reports in different modes depending on how you want to work with data and how you want the data to appear.
The following modes are available:
| • | Reading Mode—Allows you to view the existing report, search its content, and monitor changes in the report. |
| • | Design Mode—Allows you to add, delete objects in a report, apply conditional formatting, apply formulas in a report, create variables, and more. |
| • | Structure—Allows you to view and modify only the structure of the report. All the changes that you make in this mode are applied to the server only when you populate the report with data. |
| • | Data—Allows you to view and modify the report with its data displayed. |
The Data mode contains two components: The Dataset view displays the dataset as a table or through facets. The Graph Panel displays a graph of the document’s data sources, queries and cubes.
All the modifications applied in the report are automatically saved to the server. If you need to make extensive changes to an existing report, best practice is to make changes in Structure mode and then populate the report with data.
Note:For more information about the views available in Data mode, see the article Viewing Data on the SAP Learning site.
Switching Between Modes
Version:Previously, Reporter opened existing Web Intelligence reports in Design mode by default. This behavior has changed in version 4.3, where existing reports are opened in Reading mode by default.
By default, Reporter opens any existing reports in Reading mode. If you want to edit the report in any way, you need to change to a different mode.
A report is opened in Design mode in the following scenarios:
| • | You are creating a new report. |
| • | You are opening an existing report using the Modify option from the More actions  menu. menu. |
To switch from one mode to another, use the dropdown menu in the top right corner:
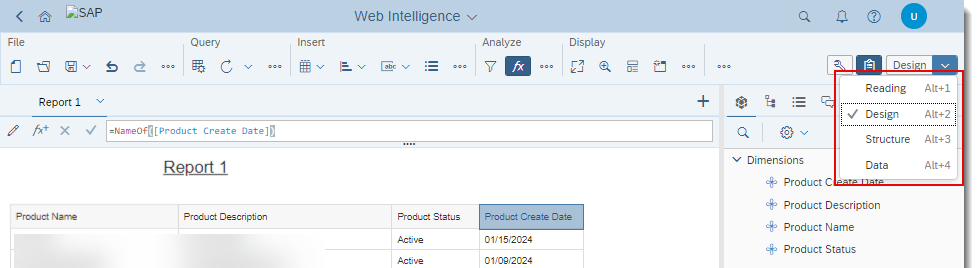
Choose the desired mode for the report.