The Custom Reports Interface
When building a custom report, you are working in the report canvas with the panes in the report editor.
The report canvas is the main area where your content appears. As you use the Filters, Visualizations, and Data panes to create visuals, they are built and shown on the canvas, as shown in this screenshot.
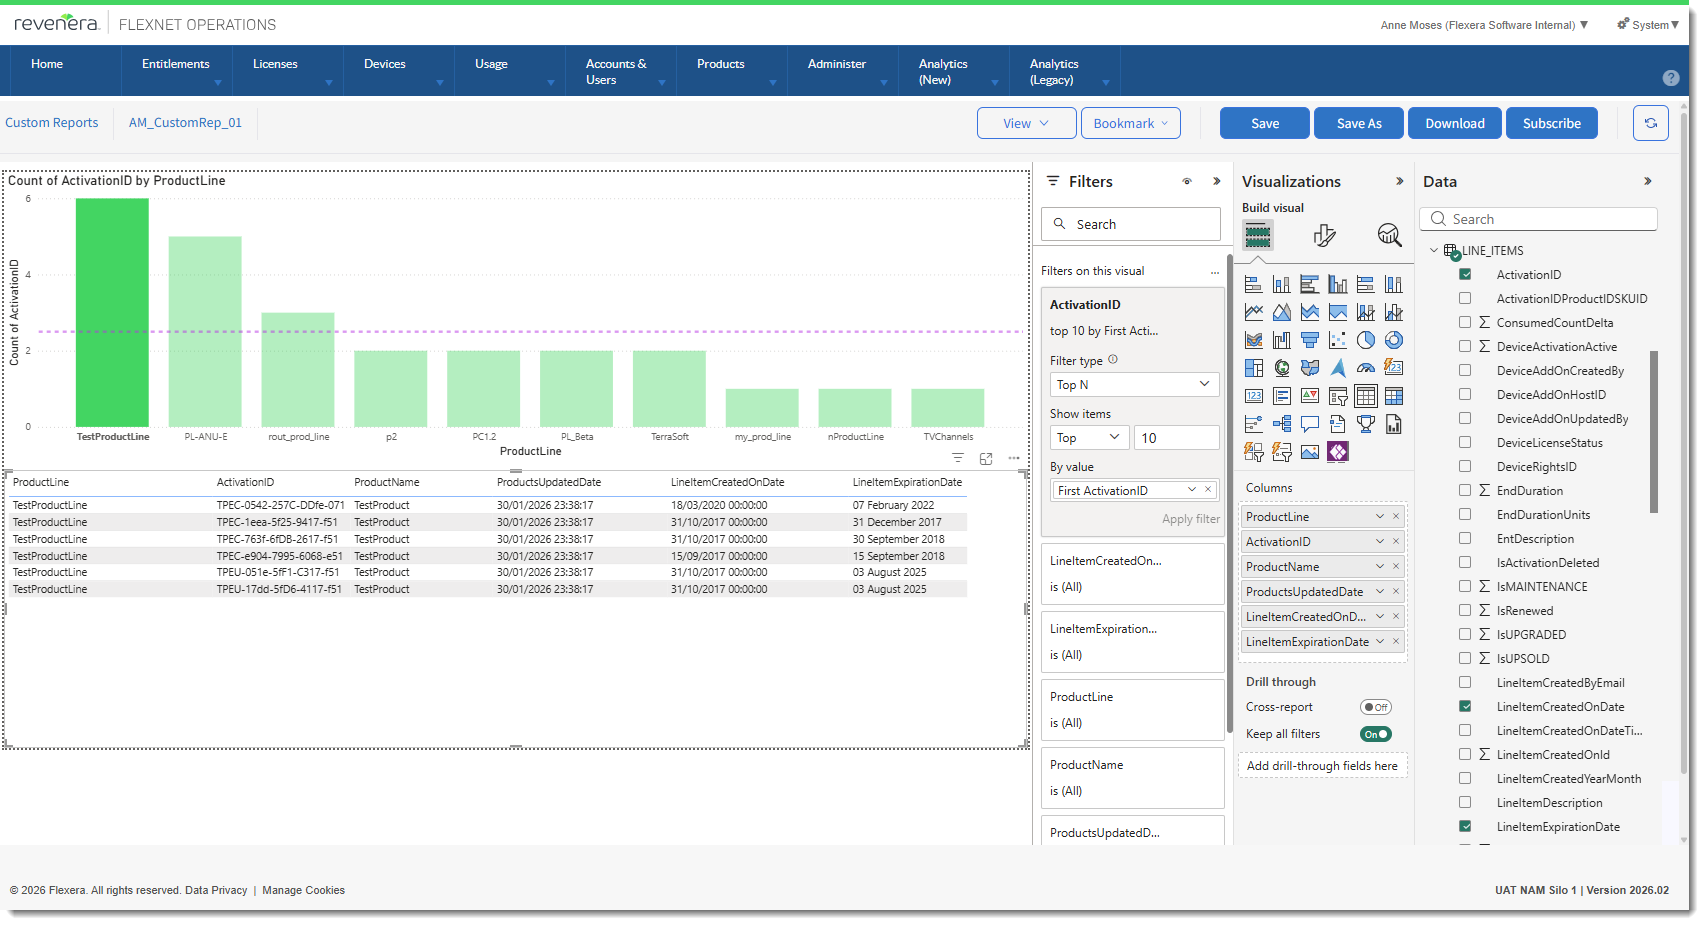
The report editor with the Filters, Visualizations, and Data panels.
When you open a report in the report editor, you see three panes: Filters, Visualizations, and Data. The first two panes, Filters and Visualizations, control what your visuals look like. They control the type, colors, filtering, and formatting. The last pane, Data, manages the underlying data used in the visuals. The content displayed in the report editor varies by selections you make in the report canvas.
The panes and associated actions are described in more detail in the following sections:
| • | The Filters Pane |
| • | The Visualizations Pane |
| • | The Data Pane |