Analytics Dashboard
The Analytics Dashboard (available from the Analytics menu) presents a number of visuals showing trends for your most important entities.
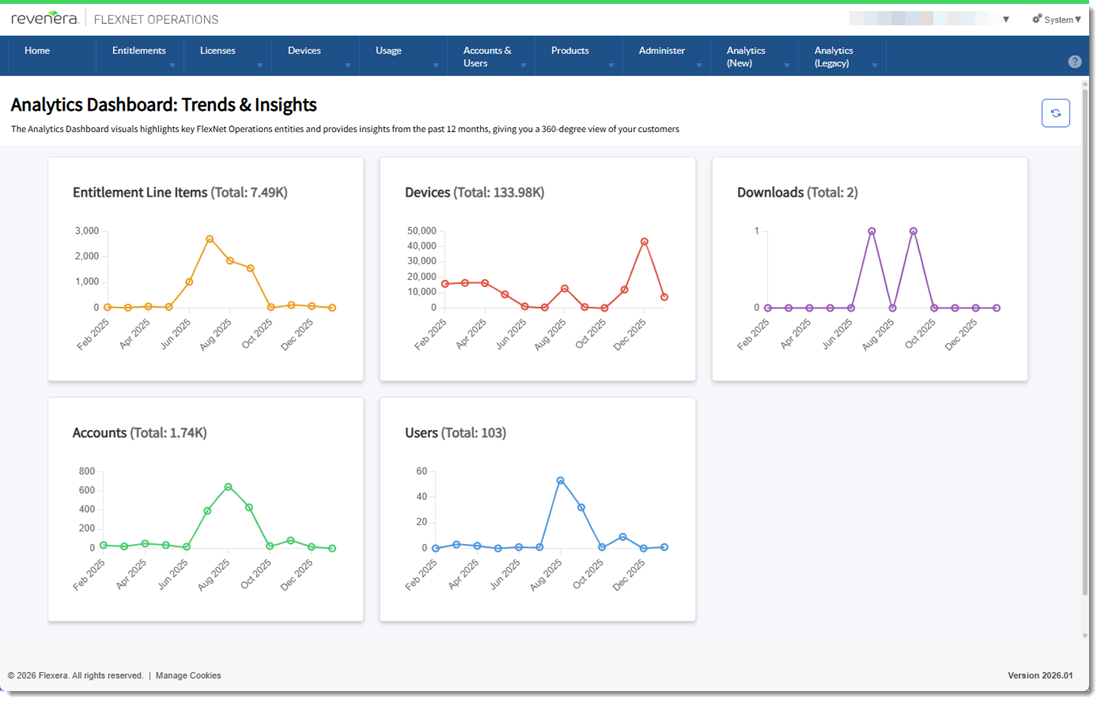
Analytics Dashboard example
By default, the data for all dashboard visuals is filtered to show a 12-month period.
All visuals in the dashboard are clickable. Clicking a visual will drill through to a detailed report with charts and tables that give a clearer picture of the relevant entities.
In the following table, the Dataset column indicates the dataset from which each visual draws its data (for more information, see FlexNet Operations Data Access APIs).
|
Dashboard Element |
Description |
Drill Through to Report |
Dataset |
|
Entitlement Line Items |
The total number of entitlement line items created in the past 12 months. |
Entitlements |
|
|
Devices |
The total number of active devices created in the past 12 months. This includes Cloud License Server (CLS) instances, local license servers, and served devices (devices that request licenses from a license server). |
Devices and Served Device |
|
|
Downloads |
The total number of downloads created in the past 12 months. |
Downloads |
|
|
Accounts |
The total number of accounts created in the past 12 months. |
Accounts |
|
|
Users |
The total number of users created in the past 12 months. |
Users |