Defining the Conditions for the Metric to Compare
In this step, you create the metric with appropriate filters on the Metric tab in the Edit Conditional Notification page. The metric defines the threshold value used for comparison with the data from the dataset.
To create the metric
|
2.
|
In the Untitled Chart field, add a name for your metric, for example, Cumulative Count of Requests for Feature “abc” Over This Quarter. You can also add a description. |
|
3.
|
Add filters to focus on a specific feature and time frame. |
To do so, open the Filter panel if it is not already open. In the Filter panel, click Add Filters. The Filter dialog box opens.
|
a.
|
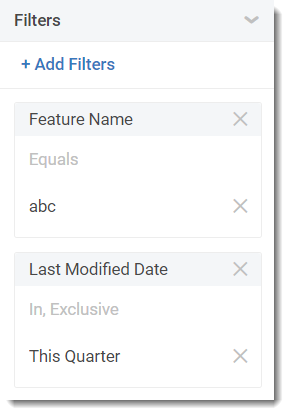
Define the filter Feature Name Equals abc. |
|
b.
|
Add a second filter Last Modified Date In, Exclusive, This Quarter. |
When the filters have been defined, the Filter panel should look similar to this:
|
4.
|
Create a cumulative aggregate for your metric: |
|
a.
|
From the Data section on the left, drag and drop the value Quantity to the Values shelf at the top. |
As soon as you add the field, the value will be shown.
|
b.
|
In the Values shelf, click the three-dot menu and select the aggregation feature SUM. |
The metric should look similar to the following:
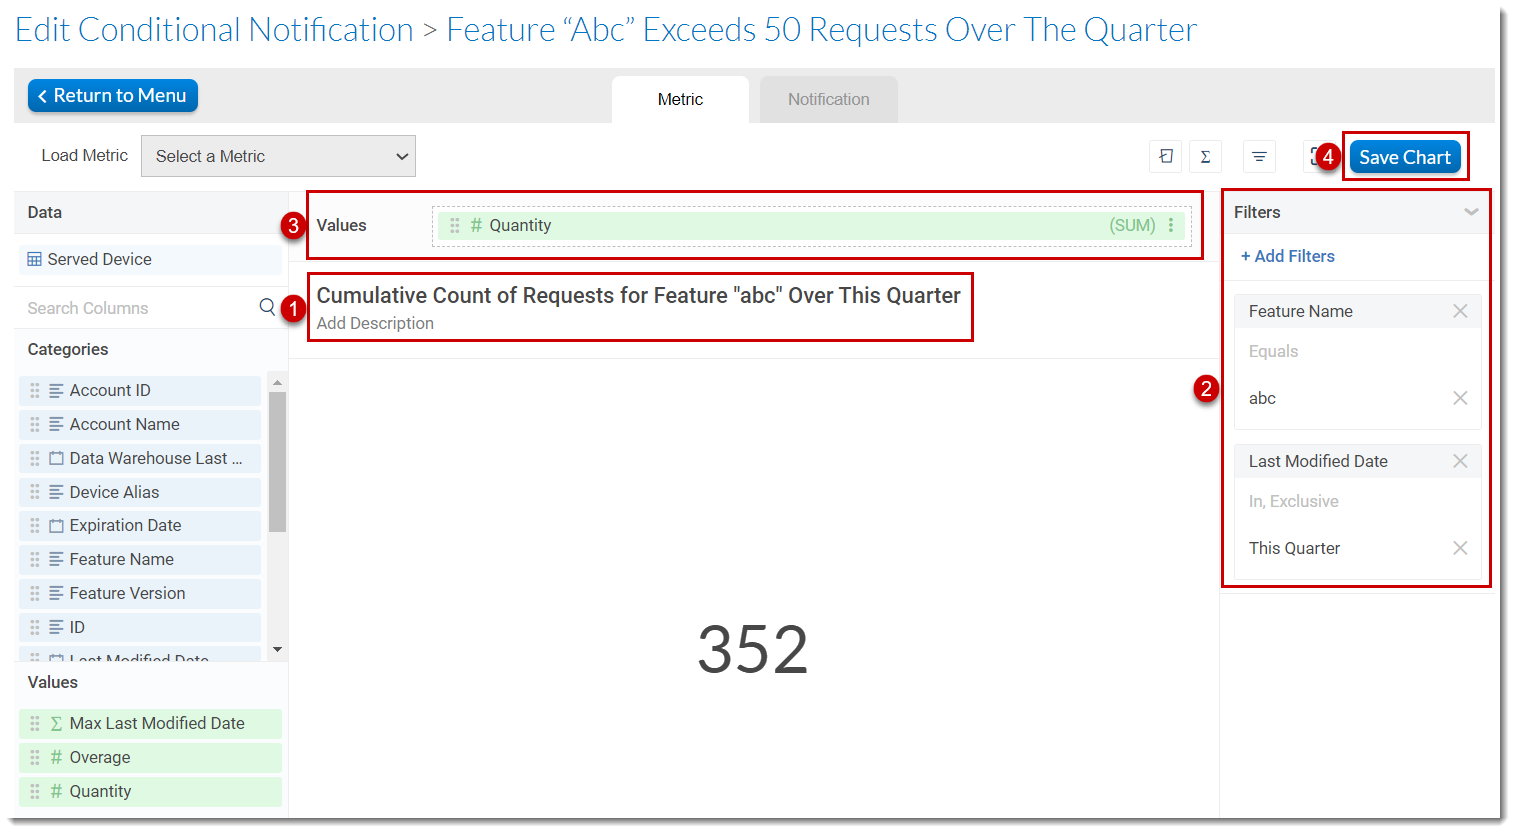
Example metric for cumulative count of requests for feature “abc” over a quarter
The screenshot shows the steps for creating the metric:
|
2.
|
Defining filters for the feature name and time frame |
|
3.
|
Defining the aggregate value |
After saving the metric, FlexNet Operations displays the Notification tab.
Continue with the steps in Scheduling the Notification With Threshold.